IX. GRAMENE: A GENOMICS AND GENETICS
RESOURCE FOR MAIZE
P. Jaiswal1, J. Ni1, I. Yap1, D. Ware2,
4, W. Spooner2, K. Youens-Clark2, L. Ren2,
X. Wei2, C. Liang2, S. Pasternak2, W. Zhao2,
I. Tecle1, B. Faga2, P. Canaran2, D.
Ravenscroft1, C. Hebbard1, S. Avraham2, T.
Casstevens3, E. S. Buckler3,4, L. Stein2, S.
Mccouch1
1Department of Plant Breeding and Genetics, 240 Emerson Hall, Cornell University, Ithaca, NY, 14853, USA; 2Cold Spring Harbor Laboratory, 1 Bungtown Rd, Cold Spring Harbor, NY, 11724, USA; 3Institute for Genomic Diversity, Cornell University, Ithaca, NY, 14853, USA; 4USDA-ARS NAA Plant, Soil & Nutrition Laboratory Research Unit, Cornell University, Ithaca, NY, 14853, USA
Maize is an important crop for the USA, with an estimated production of 300 million Mt harvested from about 30 MHa in 2004. This contributed about 40% of the total world production, but used only an estimated 20% of the world area harvested (http://faostat.fao.org/). In the US alone 2004 corn production was worth about 23 billion USD (http://www.ncga.com/). This enormous contribution of maize towards agroeconomics, both around the world and in the USA, demands a continuous improvement of the agronomic traits, such as yield, early maturation, disease resistance, tolerance to various abiotic stresses and improved nutritional and post harvest qualities. Currently the maize genome that codes for these agronomic traits is being sequenced and annotated (http://www.eng.iastate.edu/abstracts/ viewabstract.asp?id=1821). The Gramene database (http://www.gramene.org) takes advantage of the known maize genetic information and genomic colinearity (synteny) with rice and other major cereal crops. Gramene provides researchers with an excellent platform for drawing comparisons between maize and other cereals (Fig. 1).
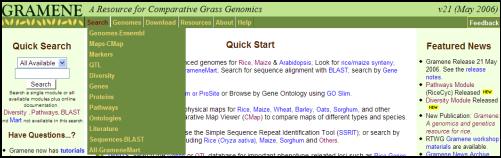

Figure 1. The Gramene web page available at
http://www.gramene.org. Users can
start with the �Quick Search� by typing their query or by following the links
provided in the �Quick Start� section.
For browsing the individual sections and datasets follow the links
provided in the drop down menus that include search, genomes, download,
resources, about and help. The
�Quick search� option is available on the top right side of the web page on all
other web pages within Gramene website.
In addition to the comparative analysis tools, Gramene maintains curated datasets that include literature, maps (genetic, physical and sequence based), markers, genes, genomes, proteins, QTL, pathways and molecular diversity. Several of these will be discussed below. Although the Gramene database provides information on a range of grass species, the datasets, their presentation or accessibility via various modules described in this report are focused on maize only, and the description is based on release #21 (May 2006) of the database.
Gramene is a collaborative project between Cold Spring Harbor Laboratory and Cornell University. We actively work with maize researchers and the MaizeGDB (Lawrence et al., 2005) (http://maizegdb.org) to provide useful genetic and genomic information on maize. The information provided via the database is either shared from MaizeGDB or curated in-house using both manual and computational methods. It is freely available and web-accessible. The technological core of Gramene is the MySQL database management system, an open source relational database system that is stable and well supported. The database and curated datasets are available and can be installed for local use by following the instructions described in the installation document (http://www.gramene.org/documentation/ gramene_installation.html).
Maps: Many geneticists and molecular breeders have an interest in exploring and comparing the genetic maps, genes and QTL from previously published literature. To enable researchers to query these existing datasets, the central comparative map search tool, CMap, can be accessed from Gramene�s �Maps� section (http://www.gramene.org/cmap/index.html). CMap presents a map as a linear array of interconnected features that correspond to either a single linkage group (in the case of a genetic map), a single contig (for a physical map), or a contig or scaffold (in the case of an annotated sequence). To set up a comparison between different map sets from either the same or different species and/or map types, the researcher first selects a reference map set, and then selects a reference map (chromosome, linkage group or contig) from within the set. This reference map serves as the basis for any comparison that one chooses to make (Fig. 2).
Currently the Maps module hosted a total of 17 maize maps (http://www.gramene.org/db/cmap/species_info?species_acc=maize) characterized into four types, namely physical (one), genetic (seven), Bin (one) and QTL (seven) maps. Except for the mapset �Maize Bins QTL 2006� the other 6 QTL maps were curated by Gramene curators emphasizing the abiotic trait QTLs mapped on them. A quick comparison of the Gramene Curated AGI FPC Oct 2004 physical map with various types of maps from several species can be viewed in the matrix format (http://www.gramene.org/db/cmap/matrix?map_type_acc=&species_acc=&map_set_acc=&map_name=&use_colors= 1&hide_empty_rows=1&show_matrix=1&link_map_set_acc=cmf1104a&prev_species_acc=&prev_map_set_acc=&prev_map_name=). In comparison to the maize �MMP IBM2 neighbors 2004� map it has about 2380 correspondences. With cross species comparison to the rice sequenced genome the number of unique hits (based on shared mapped markers) is about 24,391.

Figure 2. A comparative map display using the CMap tool. The maize maps compared are linkage
group 3 from MMP IBM2 Neighbor 2004 and INRA Io/F2 Composite QTL 1996. The features (markers) in red suggest
that a corresponding feature is present on both the maps. The labels and bars in blue present on
INRA Io/F2 Composite QTL 1996 map are for the mapped QTL on two different
traits phosphoglycerate mutase content (PGAMCN symbol) and ADP glucose
pyrophosphorylase activity (AGPACT symbols). The QTL symbols displayed are acronyms assigned by Gramene
curators for consistency in usage across several species. These symbols may be different from
published symbols, which are recorded as synonyms.
Markers: Detailed information about markers mapped on the maps described above is provided by Gramene's �Markers� section (http://www.gramene.org/markers/index.html). This module allows users to search the marker collection using one or more marker names, and a search may be refined by selecting the marker type (e.g. RFLP) and/or species (e.g. rice). A query for all RFLP marker types in maize gives 437 entries (http://www.gramene.org/db/markers/marker_view?marker_name=*&marker_type_id=3&species_id=4&action= marker_search). The marker details include marker name, synonym(s), type, species, the germplasm from which it was derived (if available), maps on which the marker can be found, and genome position(s) on the rice-japonica Nipponbare genome sequence, e.g. the maize marker CSU63 (Fig. 3) (http://www.gramene.org/db/markers/marker_view?marker_name=CSU63&marker_type_id=&species_id= 4&action=marker_search).
Diversity: The genetic diversity database contains SSR and SNP allelic data, passport descriptions and associated phenotypes for maize germplasms. The major goal of this database is to be a resource for evolutionary, domestication, association, and genetic diversity studies on rice, maize and wheat. The maize diversity dataset presented on Gramene is imported from the Molecular and Functional Diversity of the Maize Genome project database (Zhao et al., 2006) available from http://www.panzea.org/. The introduction of the diversity database and links to various sections within Gramene will help users on potential applications such as germplasm management, marker assisted selection and DNA-based variety identification.
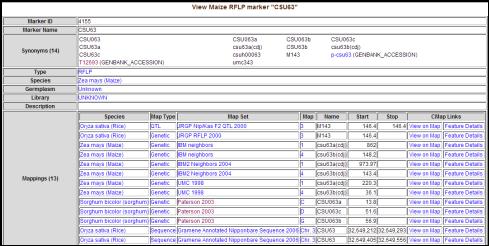

Figure 3. The Marker detail view. The maize marker CSU63 was found to be mapped on several
maps recoded in Gramene database.
This includes a sequence based mapping on the rice genome map �Gramene
Annotated Nipponbare Sequence 2006�.
The database can be searched by germplasm accession number, accession name or marker/locus name. Searches can also be performed on the molecular diversity and phenotype, e.g. search the maize germplasm BOV 492 (http://www.gramene.org/db/diversity/ diversity_view?search_for=BOV+492&object=&db_name=database_maize21&action=list) and view the details about it (e.g. http://www.gramene.org/db/diversity/diversity_view?action=view&object=div_passport&id=17). A user can find information on the experiment design as well as the alleles observed in it. For more detailed queries (not provided by web based search interface) you should use the standalone browser called The Genomic Diversity and Phenotype Connection (GDPC) (Casstevens and Buckler, 2004). Please visit http://www.gramene.org/diversity/gramene_gdpc.html to download and learn about the tool.
QTL: The �QTL� section (http://www.gramene.org/qtl/index.html) facilitates the comparative study of QTL and their mapped regions in order to investigate colinear regions found to carry genes and QTLs identified in the maize and other grasses, and to investigate whether the same region/loci also contributes to similar traits and functions. Gramene does not currently curate raw QTL segregation data, but rather it emphasizes the presentation of basic QTL information such as the trait name, symbol, mapped position on the genetic, cited reference, and free-text comments, e.g. osmotic adjustment capacity QTL, AQFS427 (http://www.gramene.org/db/qtl/qtl_display? qtl_accession_id=AQFS427). The trait descriptions are mapped to a controlled vocabulary called the trait ontology (TO), which is a standardized vocabulary of traits to comparisons of phenotypes across species (Fig. 4). As of May 2006, the QTL module includes about 1700 maize QTL identified for 72 traits. Users can browse these traits and QTL by eight major trait families related to abiotic stress (113 qtl), biotic stress (6 qtl), fertility (none), anatomy (217 qtl), development (274 qtl), vigor (233 qtl), quality (143 qtl) and yield (495 qtl). The majority of the maize QTL were imported from MaizeGDB, but a handful on abiotic stress were curated by Gramene curators.
Genome: The maize genome (http://www.gramene.org/Zea_mays/) provides a graphical display of the annotations of the 504 full-length Zea mays clones deposited with GenBank as of 26-Jan-2006 (Fig. 5).
Annotations include various tracks displaying sequence alignments and details on the predicted genes, transcripts, peptides, ESTs, EST clusters (PlantGDB-TUGs, TIGR-GIs and MMP consensus), genetic markers (RFLP, SSR), flanking sequence tags (FSTs) from the mutant insertion lines, Hicot and Methyl filter reads and clusters from maize sequencing projects and other features of interest. This is a quick way to find the above datasets aligned to the gene(s) or BACs of interest.
In
addition to the sequenced BAC views, the maize genome browser hosts an FPC
physical map (Fig. 6) developed by the Arizona Genomics Institute
(AGI; http://www.genome.arizona.edu/fpc/maize/). It is currently comprised of the 760
contigs from the AGI 25 Oct 2004 release.
The
Ensembl synteny viewer
(http://www.gramene.org/Oryza_sativa/syntenyview?otherspecies=Zea_mays) displaying
the patterns of long-range synteny among the rice and maize genomes
provides a useful comparative tool for users to find colinear
regions of the rice and maize genomes as they search for genes,
their functional orthologs and shared genetic markers. We constructed syntenic blocks between
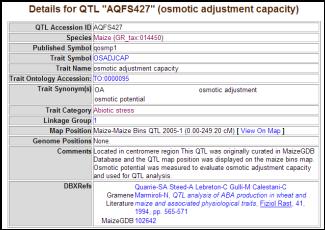

Figure 4. The QTL view.
Details about the QTL on osmotic adjustment capacity (OSADJCAP) include,
trait symbol, name, published symbol, linkage group, comments and citations. The hyperlinks from map position
connect to the comparative map display.
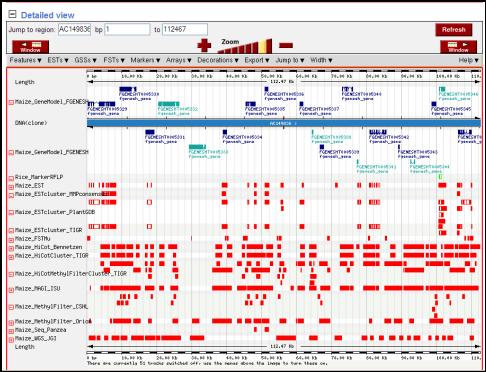

Figure 5. The maize genome browser view. Detail view of the sequenced BAC clone AC149836. The display allows zoom in and out,
adding and removing tracks (follow drop down menus like features, ESTs, GSS,
etc) and export the sequence and mapped features in various formats. The gene models in blue color suggest
that there is a predicted ortholog from either or both rice and Arabidopsis.
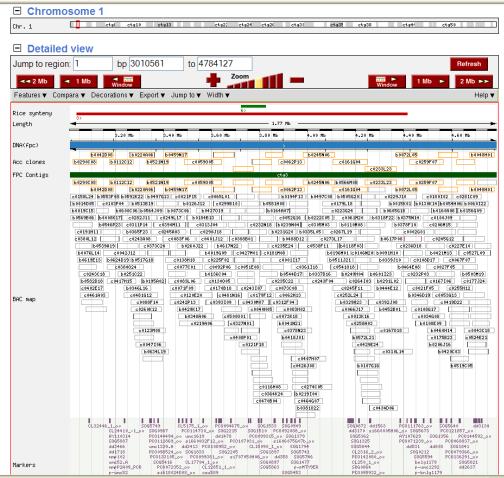

Figure
6. The contig view in the maize
FPC map. The details include
contigs, BACs, BAC ends, markers.
rice and maize by constructing a sorted pairwise list of locations of mapped overgo markers on the maize FPC map and then identifying their corresponding locations on the rice genome (Fig. 7) (D. H. Ware et al., unpublished data).
The annotated rice genome and its pre-computed comparisons with the maize and Arabidopsis gene models (genes) help users familiar with the function(s) or phenotype(s) of known gene(s) to traverse between these genomes and find the expressed, known and/or predicted gene sequence(s) based on either orthology or on gene function(s) (Fig. 8).
BLAST: The most frequently used tool on the Gramene
website is the BLAST search (http://www.gramene.org/Multi/blastview). This allows users to perform similarity
searches against sequence datasets that include bacterial artificial clones
(BACs), BAC ends, proteins, ESTs, markers, genes (CDS), cDNAs, and FSTs such as
Mu insertion lines from maize.
Users can also query the maize sequence against the similar sequence
datasets from other cereals, as well as genomes from rice and Arabidopsis, in
order to find a gene, protein, region or phenotype of interest.
Genes: The �Genes� section
(http://www.gramene.org/rice_mutant/index.html) is a curated resource that in
part provides publicly available information on genes from maize. It includes descriptions of genes,
morphological, developmental and agronomically important phenotypes, and
variants of physiological characteristics, biochemical functions and
isozymes. Users can search for
genes by their name, symbol or accession number. For example, a search for �tassel� yields as many as 16
genes with the word �tassel� appearing in either the
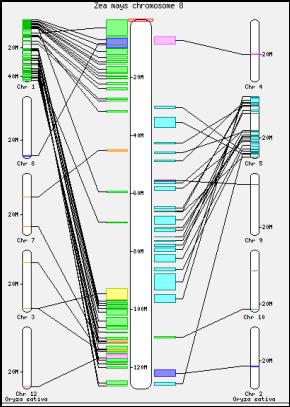

Figure
7. The macro level synteny
overview between the Maize Chromosome 8 and rest of the rice genome.
gene name or the description (http://www.gramene.org/db/genes/search_gene?query=tassel*&search_field=name&gene_type_id=& species=2&query_submit=Search). As of May 2006, the database contained 6,676 maize genes, many fully annotated with phenotypic descriptions, map positions and citations. These were imported from MaizeGDB. In future we will collaborate with the MaizeGDB to provide associations to trait (TO) (Jaiswal et al., 2002) , plant structure (PO) (Jaiswal et al., 2005) and plant growth stages (GRO), similar to the information presented on rice e.g. slender rice (slr) gene (http://www.gramene.org/db/mutant/search_mutant?id=GR:0060842). This will enhance the comparison of phenotypes, expression and functional information among the orthologs from maize and other cereals e.g. maize D8 (http://www.gramene.org/db/genes/search_gene?acc=GR:0200107) as well as the height-regulating gene orthologs, wheat RHT and rice slender rice (slr) (Ikeda et al., 2001).
Proteins: This section (http://www.gramene.org/protein/index.html) provides curated information on approximately 4200 Swissprot-Trembl protein entries from genus Zea, of which the majority (4000) belong to Zea mays (maize). Protein entries are annotated using the Gene Ontology (GO) (Clark et al., 2005) for biochemical characterization. For example (Fig. 9), see the COX2 protein (http://www.gramene.org/db/protein/protein_search?acc=P00412). Information stored in this module is derived from Swissprot-Trembl protein sequence database, or generated by computational analysis that finds functional domains, transmembrane regions, signal peptides, etc. The report on functional characterization is supported with cited references along with a corresponding evidence code (experiment type http://www.gramene.org/plant_ontology/evidence_codes.html).
Ontologies: With the increasing demands of large scale genomic
experiments that generate large datasets related to gene expression and
phenotype analyses, the requirement for use of controlled vocabularies
(ontologies) has become more apparent (Clark et al., 2005; Jaiswal et al., 2005). The ontologies are organized in categorical hierarchies of
parent terms and child (more specialized) terms. For example the trait term �plant height�
has two parents, suggesting that it is a subtype of shoot
anatomy and morphology trait and is also a sub type of height related trait
(http://www.gramene.org/db/ontology/search_term?id=TO:0000207). This helps the user to find the
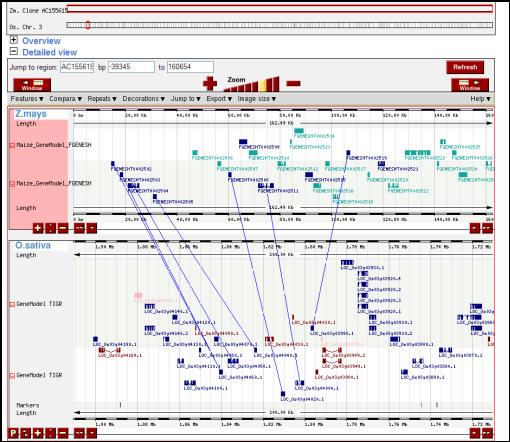

Figure
8. Micro level synteny view
between rice and maize. These
displays suggest the conservation of gene order within the two genomes.
associated genes and QTL either via the anatomy or the height-related trait path of the ontology tree and still get the same query result. For example there are 219 maize QTL associated to trait �plant height�. To emphasize the use of such vocabularies to help users find genes, proteins, QTL, map sets and traits (Fig. 1, http://www.gramene.org/plant_ontology/index.html), we have adopted various ontologies including the gene (GO: Clark et al., 2005), plant (PO: (Jaiswal et al., 2005)), cereal plant growth stages (GRO), trait (TO: Jaiswal et al., 2002), environment (EO) and taxonomy (GR_tax) ontologies in our data annotation protocols.
User Assistance: To help users of our database, we provide pre-designed queries, glossaries and frequently asked questions (FAQs) sections. On-line tutorials (http://www.gramene.org/tutorials/) guide users through a step-by-step process to retrieve information from the database. General information about various cereal crop plants, including their genetic or evolutionary histories, production profiles, biology and commercial uses is also provided (http://www.gramene.org/species/index.html). For more information about Gramene, or to contribute suggestions, please contact Gramene at [email protected].
We kindly request group(s)/person(s) who use the information derived from Gramene curation activities (EST alignments, mutants, comparative maps, gene and trait ontology annotations) to acknowledge the Gramene project contribution by citing the web address http://www.gramene.org/ and any of the appropriate Gramene publications (Jaiswal et al., 2002; Ware et al., 2002a; Ware et al., 2002b; Jaiswal et al., 2006).
This Gramene project was originally supported by the
USDA Initiative for Future Agriculture and Food Systems (IFAFS) (grant no.
00-52100-9622) and USDA-Agricultural Research Service specific cooperative
agreement (grant no. 58-1907-0-041). During 2004-2007 this
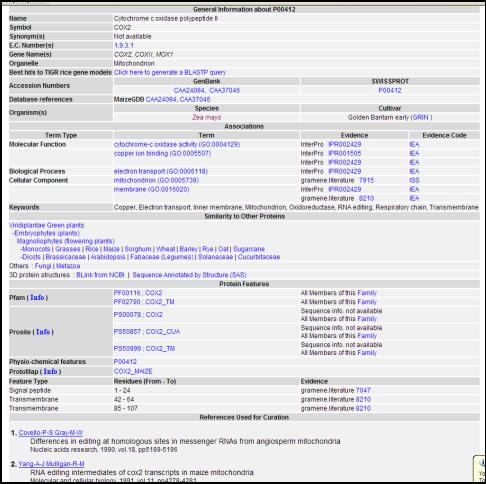

Figure 9. The protein detail page showing associations to ontology
terms describing its function and role in a biological process, evidences,
citations and links to search for homologs and orthologs based on sequence
similarity.
work is also supported by the National Science Foundation (NSF) award #0321685 and USDA-ARS. We are thankful to numerous collaborators, researchers and contributors from the cereal research community for sharing their datasets and for help in curation.
References
1 Casstevens, T.M. and Buckler, E.S. 2004. GDPC: connecting researchers with multiple integrated data sources. Bioinformatics 20:2839-2840. Epub 2004 Apr 2822.
2 Clark, J.I., Brooksbank, C. and Lomax, J. 2005. It's all GO for plant scientists. Plant Physiol. 138:1268-1279.
3 Ikeda, A., Ueguchi-Tanaka, M., Sonoda, Y., Kitano, H., Koshioka, M., Futsuhara, Y., Matsuoka, M. and Yamaguchi, J. 2001. Slender rice, a constitutive gibberellin response mutant, is caused by a null mutation of the SLR1 gene, an ortholog of the height-regulating gene GAI/RGA/RHT/D8. Plant Cell 13:999-1010.
4 Jaiswal, P., Avraham, S., Ilic, K., Kellogg, E.A., Pujar, A., Reiser, L., Seung, R.Y., Sachs, M.M., Schaeffer, M., Stein, L., Stevens, P., Vincent, L., Ware, D. and Zapata, F. 2005. Plant Ontology (PO): a controlled vocabulary of plant structures and growth stages. Comparative and Functional Genomics 6:388-397.
5 Jaiswal, P., Ni, J., Yap, I., Ware, D., Spooner, W., Youens-Clark, K., Ren, L., Liang, C., Zhao, W., Ratnapu, K., Faga, B., Canaran, P., Fogleman, M., Hebbard, C., Avraham, S., Schmidt, S., Casstevens, T.M., Buckler, E.S., Stein, L. and McCouch, S. 2006. Gramene: a bird's eye view of cereal genomes. Nucleic Acids Res. 34:D717-723.
6 Jaiswal, P., Ware, D., Ni, J., Chang, K., Zhao, W., Schmidt, S., Pan, X., Clark, K., Teytelman, L., Cartinhour, S., Stein, L. and McCouch, S. 2002. Gramene: development and integration of trait and gene ontologies for rice. Comparative and Functional Genomics 3:132-136.
7 Lawrence, C.J., Seigfried, T.E. and Brendel, V. 2005. The maize genetics and genomics database. The community resource for access to diverse maize data. Plant Physiol. 138:55-58.
8 Ware, D., Jaiswal, P., Ni, J., Pan, X., Chang, K., Clark, K., Teytelman, L., Schmidt, S., Zhao, W., Cartinhour, S., McCouch, S. and Stein, L. 2002a. Gramene: a resource for comparative grass genomics. Nucleic Acids Res. 30:103-105.
9 Ware, D.H., Jaiswal, P., Ni, J., Yap, I.V., Pan, X., Clark, K.Y., Teytelman, L., Schmidt, S.C., Zhao, W., Chang, K., Cartinhour, S., Stein, L.D. and McCouch, S.R. 2002b. Gramene, a tool for grass genomics. Plant Physiol. 130:1606-1613.
10 Zhao, W., Canaran, P., Jurkuta, R., Fulton, T., Glaubitz, J., Buckler, E., Doebley, J., Gaut, B., Goodman, M., Holland, J., Kresovich, S., McMullen, M., Stein, L. and Ware, D. 2006. Panzea: a database and resource for molecular and functional diversity in the maize genome. Nucleic Acids Res. 34:D752-757.