CÓRDOBA, ARGENTINA
Universidad Nacional de Río Cuarto
Discriminant analysis applied to phenotypic evaluation of Mal de Río Cuarto disease in recombinant inbred lines of maize
— Faricelli, ME; Di Renzo, MA; Bonamico, NC; Ibañez, MA
Mal de Río Cuarto (MRC) is the most important viral disease of maize (Zea mays L.) in Argentina. Several symptoms are shown by diseased plants depending on the maize genotype, the plant’s development stage in which the vector-mediated virus transmission occurs and the environmental conditions under which maize grows. This variety of symptoms ranges from presence of enations on the abaxial side leaves exclusively to the presence of enations but also shortened superior internodes and “hokey pole” ears when infections occur at early development stages. Because of the diversity of symptoms found with a single incidence level, the possibility of applying a Disease Severity Index (DSI) to evaluate MRC in field experiments is of great interest. An appropriate index should consider the most contributing phenotypic characters to the total variation between the different severity levels.
Various multivariate methodologies are used for analyzing multiple characters in plants. Discriminant Analysis (DA) constitutes a useful tool for not only identifying variables discriminating between previously defined groups but also classifying new cases in such groups. When discriminant variables are found, they can be used to create discriminant functions.
The objective of this work was to identify phenotypic characters discriminating between maize F6 recombinant inbred lines (RIL) groups of different performance to MRC and to obtain the corresponding discriminant functions, for validating the effectiveness of applying DSI in the disease field evaluations.
Both tolerant (BLS14) and resistant (Mo17) to MRC inbred lines were used as parents and 73 descendent F6 RIL of maize were evaluated during the growing season 2003–04 at the Río Cuarto location under irrigated conditions (IC) and unirrigated conditions (UC). A randomized complete block design was used, in which each genotype was a plot. The phenotypic characters measured on individual plants of each plot were: plant length (PL); tassel flowers number and fertility (T); ear features such as ear shortening (SE), proportion of empty ear (EE), multiple ears (ME), “hokey pole” ear (CE) and ear absence (AE); leaves features such as creased leaf (CL) and tiered leaf (TL); presence of enations (E); superior internodes shortening (SI). A four-grade disease severity scale (0: no symptoms; 1: enations; 2: enations and “hokey pole” ears; 3: enations, shortened superior internodes and small ears with few or no kernels) was used to assign a severity grade to each plant. A DSI based on disease severity grade was calculated for each plot as follows: DSI = ∑ [(grade × plants number in each grade)] × 100 / (3 × total plants number). Maize families were grouped based on their performance to MRC in the field evaluation, according to their DSI value, into resistant (R, 0% ≤ DSI < 30%), partially resistant (P, 30% ≤ DSI < 70%) and susceptible (S, 70% ≤ DSI ≤ 100%) groups.
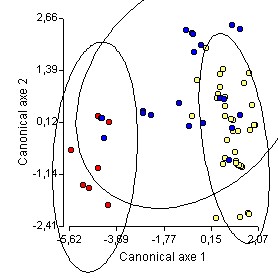
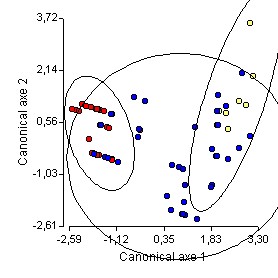
DA was used for analyzing the dataset. The first canonical axis explained 90.62% and 87.61% of the total variation between R, P and S groups in IC and in UC, respectively. Two discriminant functions were originated for the three previously defined groups. The first canonical discriminant function for IC, F = -4.10 + 3.60 E + 1.74 SI – 1.17 SE, was the best for classifying the families into the groups. The best canonical discriminant function for UC was F = -1.40 + 2.18 E – 0.88 SE + 0.82 SI. In both environmental conditions E was the most discriminating variable between R, P and S groups on the first canonical axis. SI was the second most important variable for discriminating in IC, while it was the third one in UC. Various ear features contributed in discriminating families to a lesser extent.
Figures 1 and 2 show that the R group was opposed to the S group on the first canonical axis, indicating E successfully discriminated genotypes between these two groups. The P group overlapped with both the R and S groups in IC and in UC.
When canonical discriminant functions were used for classifying new cases into the previously defined groups, the total classification error rates were 20.00% in IC and 22.67% in UC. The high partial error rates for classifying genotypes belonging to the P group (35.00% and 47.22% in IC and in UC, respectively) were responsible of these high total error rates. This result could be due to the great rank of DSI values that P families could take, either near R DSI values or near S DSI values. The partial classification error rates for classifying genotypes belonging to R group were 0.00% in both environmental conditions and those for discriminating the S group were 0.00% in UC and 17.00% in IC.
Having found E the most discriminating variable between the R, P and S groups, followed by SI and various ear features, it could be suggested that the effective application of DSI in MRC field evaluations is appropriate, since these phenotypic characters are used in the index construction.
Figure 1. Multivariate observations of resistant (red), partially resistant (blue) and susceptible (yellow) to MRC F6 recombinant inbred lines of maize in the discriminant space under irrigated conditions
Figure 2. Multivariate observations of resistant (red), partially resistant (blue) and susceptible (yellow) to MRC F6 recombinant inbred lines maize in the discriminant space under unirrigated conditions
Return to the MNL Volume 79 Index
Return to the index of Maize Newsletters
Return to the Maize Genome Database Page