The existence of such a water circuit in the plant�s body is an essential condition for the metabolic activity and also for the plant�s survival.
In summer heat, a maize plant can eliminate a quantity of water that could exceed the water content of the entire plant in one hour (D. Dorobantu, Plant Physiol. 72, 1977).
These large quantities of water eliminated by transpiration have to be analysed in connection with the other physiological processes. The transpiration participates in the passive absorption of the water, causes the ascending circulation of water and mineral nourishing substances, provides the normal turgidity of all cells, provides the constant maintenance of the vegetable organism�s temperature and does not permit the heating of the tissues.
In order to provide this water, the plant absorbs water permanently from the external medium not only through the root (which is the specialised organ for this function), but also through the aeral organs. Leaves absorb water intensely due to their anatomical particularities.
The quantity of water (dew, rainfall) absorbed by leaves is insufficient for the normal activity of plants (5-10% of the necessary quantity) but, when leaves are young and have a thin coat of cuticle, the absorption can attain approximately 50% of the necessary quantity of water (D. Dorobantu, Plant Physiol. 64, 1977).
If every physiological process is determined and genetically controlled and the plant�s metabolism on the whole has a genetic determination, the question is:
-Is the selection of genotypes, in all their complexity, possible by analysing distinct physiological aspects that provide the functionality of the plant�s body as a whole?
In this work we tried to analyse two physiological aspects: the transpiration and the leaf absorption of 8 inbred lines of maize in different vegetative stages.
As far as these physiological characters can be correlated or not with the production capacity and the index of drought sensibility (characters that have a complex genetic determination),we�ll be able to select easier and faster valuable genotypes from the point of view of drought resistance and also of production capacity.
The index of drought sensibility was calculated after the Morizet�s formula (J. Morizet et al., Colloque Phisiologie du mais: INRA 493-501, 1990).
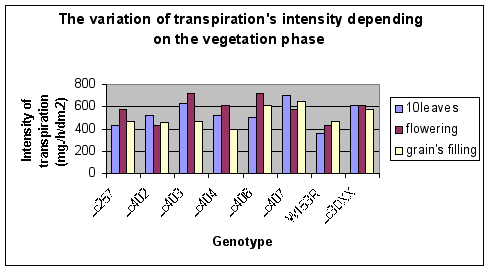
The transpiration�s intensity varies between very large limits during the day (Table 1), having a maximum at 12 o�clock a.m. and then decreasing towards 5 o�clock p.m., but also varies from one vegetative stage to another. The most intense transpirations registered in the flowering period (Graph 1).
Table 1. The intensity of transpiration of maize inbred lines (mg water/h/dm2)
| Vegetative phases | Hour | Genotype | ||||||||||||||||
| Lc257 | ±x | Lc402 | ±x | Lc403 | ±x | Lc404 | ±x | Lc406 | ±x | Lc407 | ±x | W153R | ±x | Lc3Dxx | ±x | X | ||
| 10 leaves | 10a.m | 108 | 144 | 198 | 252 | 216 | 270 | 108 | 252 | |||||||||
| 12a.m | 198 | 198 | 252 | 144 | 144 | 234 | 126 | 162 | ||||||||||
| 6 p.m. | 126 | 180 | 180 | 126 | 144 | 198 | 126 | 198 | ||||||||||
| Total | 432 | -103.5 | 522 | -1.5 | 630 | 76.5 | 522 | -1.5 | 504 | -49.5 | 702 | 148.5 | 360 | -193.5 | 612 | 58.5 | 553.5 | |
| Flowering | 10a.m | 216 | 108 | 216 | 144 | 108 | 144 | 108 | 144 | |||||||||
| 12a.m | 144 | 144 | 216 | 288 | 324 | 252 | 144 | 216 | ||||||||||
| 6 p.m. | 216 | 180 | 288 | 180 | 288 | 180 | 180 | 252 | ||||||||||
| Total | 576 | -9.0 | 432 | -153.0 | 720 | 135.0 | 612 | 27.0 | 720 | 135.0 | 576 | -9.0 | 432 | -153.0 | 612 | 27.0 | 585.0 | |
| Grain filling | 10a.m | 144 | 144 | 144 | 144 | 144 | 252 | 144 | 180 | |||||||||
| 12a.m | 144 | 204 | 180 | 180 | 324 | 288 | 216 | 288 | ||||||||||
| 6 p.m. | 180 | 108 | 144 | 72 | 144 | 108 | 108 | 108 | ||||||||||
| Total | 468 | -43.5 | 456 | -55.5 | 468 | -43.5 | 396 | -115.5 | 612 | 100.5 | 648 | 136.5 | 468 | -43.5 | 576 | 64.5 | 511.5 | |
Lc406, Lc407 and Lc3DXX have maximum values of transpiration in the ten leaf stage at 10 o�clock a.m. After that transpiration continues to decrease towards the evening in Lc406 and Lc407, although in Lc3DXX transpiration intensity increases again after midday.
In the flowering period, the only genotype that makes an exception from the general rule is Lc257, whose lowest value of transpiration intensity is at 12 o�clock a.m.
The genotype�s specificity in the determination of the daily and seasonal transpiration intensity becomes obvious.
It is well known that plants that transpire more intensely have a more active photosynthesis and grow more intensely, a fact that is obvious in the genotypes studied until the flowering period.
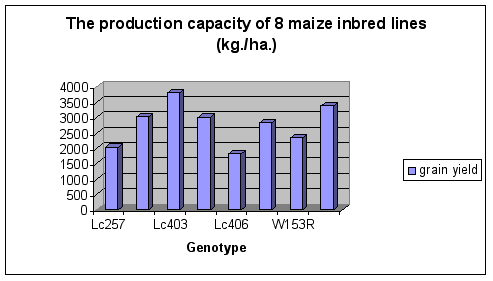
The production capacity (grain yield), whose elements form and finalize in this vegetation period, seems to be influenced by the transpiration intensity from the period before flowering (correlations between production and transpiration intensity in the ten leaf stage are positive) (Table 3).
In the ten leaf stage and also in the flowering period, Lc 403 and Lc3DXX present a positive difference in the intensity of transpiration (Table 1) in comparison with the average, a fact that might be an explanation for the good production realized by these genotypes. The other genotypes (the rest of them) have either negative values in comparison with the control, or one positive value and the other negative.
Less important is the grain filling phase because the production elements are already finalized.
The difference between the ten leaf stage and the flowering period concerning the (total) intensity of transpiration varies from one genotype to another (from +216 to �90 mg water/h/dm2).
The great effort of the plant to increase the intensity of transpiration in this period of intense growth and finalization of production, with 216 mg/h/dm2 (Lc406) and 144 mg/h/dm2 (Lc 257), can be interpreted as a large consumption of energy and has lots of implications in the lessening of the production capacity (grain yield) (Graph 2).
The capacity of water�s foliar absorption is more intense in the first vegetation phases when the leaves are younger and have a thinner cuticle.
It also decreases in the flowering period and rises very easily in the grain filling period (Table 2).
Table 2. The capacity of water�s foliar absorption in different vegetation
phases (g water/100g fresh substance)
| Genotype | 10 leaves | flowering | Grain filling |
| Lc 257 | 6.08 | 5.03 | 5.1 |
| Lc 402 | 6.1 | 5.2 | 5.37 |
| Lc 403 | 6.42 | 5.1 | 5.97 |
| Lc 404 | 6.89 | 5.27 | 6.1 |
| Lc 406 | 7.5 | 6.93 | 7.15 |
| Lc 407 | 7.52 | 7.15 | 7.34 |
| W153R | 8.5 | 6.21 | 6.92 |
| Lc3DXX | 8.71 | 7.1 | 8.1 |
The diminution of the leaves�capacity for absorption is obvious during the vegetation period due to the aging of the leaves and thickening of the cuticle, but also to the reduction of the foliar surface as a result of the basic drying of the leaves.
This is probably the explanation for the increase of the foliar absorption from the flowering period to the grain filling period.
The highest difference between these two periods of development is present in Lc3DXX (1 g/100 g fresh substance) and Lc 403 (0.87 g/100 g fresh substance) which also have the best production (grain yield).
By analysing the correlations between the water�s foliar absorption (in three vegetative phases), the intensity of transpiration (in three vegetative phases at different hours of the day), the production capacity (grain yield) and the index of drought sensibility (Table 3), we can observe that:
Table 3. The correlation between the capacity of foliar absorption,
the transpiration intensity, the grain yield and the index of drought sensibility
|
|
|
|
|
|
|
|
|
|
|
|
|
|
|
|
|
|
|
|
|
|
|
|
|
|
|
|
|
|
|
|
|
|
|
|
|
|
|
|
|
|
|
|
|
|
|
|
|
|
|
|
|
|
|
|
|
|
|
|
|
|
|
|
|
|
|
|
|
|
|
|
|
|
|
|
|
|
|
|
|
|
|
|
|
|
|
|
|
|
|
|
|
|
|
|
|
|
|
|
|
|
|
|
|
|
|
|
|
|
|
|
|
|
|
|
|
|
|
|
|
|
|
|
|
|
|
|
|
|
|
|
|
|
|
|
|
|
|
|
|
|
|
|
|
|
|
|
|
|
|
|
|
|
|
|
|
|
||
|
|
|
|
|
|
|
|
|
|
|
|
|
|||
|
|
|
|
|
|
|
|
|
|
|
|
||||
|
|
|
|
|
|
|
|
|
|
|
|||||
|
|
|
|
|
|
|
|
|
|
||||||
|
|
|
|
|
|
|
|
|
|||||||
|
|
|
|
|
|
|
|
||||||||
|
|
|
|
|
|
|
|||||||||
|
|
|
|
|
|
||||||||||
|
|
|
|
|
|||||||||||
|
|
|
|
||||||||||||
|
|
|
-There is a negative correlation between the capacity of foliar absorption (in all the vegetation phases) and I.S. (the index of drought sensibility).
-In the ten leaf stage, the lower the capacity of absorption, the higher the intensity of transpiration (r =-0.539, the ten leaf stage, 12 o�clock a.m.).
-There is a positive correlation between the capacity of foliar absorption in all vegetation phases and the intensity of transpiration in the grain filling period at 12 o�clock a.m., and even between the capacity of absorption in the flowering period and the intensity of transpiration in the grain filling stage at 10 o�clock a.m. (r =0.638).
-The production (grain yield) seems to be positively correlated with the intensity of transpiration in the ten leaf phase at 6 o� clock p.m. (r =0.638).
-If the index of drought sensibility can be negatively correlated with the intensity of transpiration in the grain filling period at 10 o�clock a.m. (r =-0.607), things change radically at 6 o� clock p.m. (r =0.606), and the same phenomenon is observed even in the flowering period at 6 o�clock p.m. (r =0.604).
-The higher the intensity of transpiration in the grain filling phase (at 10 o�clock a.m.), the higher it was in the ten leaf phase (at 10 o�clock a.m., r =0.585).
-A correlation of the same intensity, but contrary was observed between the transpiration intensity (at 10 o�clock a.m., flowering stage) and the transpiration intensity in the grain filling period (at 12 o�clock a.m., r =-0.578) and at 6 o�clock p.m. (r =0.578).
The analysis of these results shows that sometimes there are totally unexpected correlations between the physiological processes during the vegetation period, a fact that proves the complexity of the genetic factors implied in the coordination of these processes .
Since the goal of every improvement process is to obtain genotypes with
a better production capacity (grain yield), but also with a genetic resistance
to stress factors (drought, in our case), it is important to observe the
physiological aspects in their interaction, during the vegetation period,
in order to determine a genotype that presents the most favourable characters.
Return to the MNL 77 On-Line Index
Return to the Maize Newsletter Index
Return to the MaizeGDB Homepage