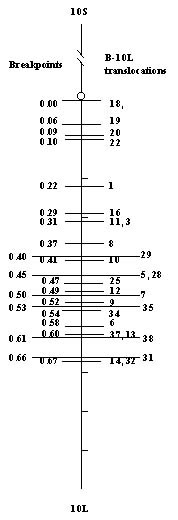
Table 1. Cytological breakpoint on 10L of 17 B-10L translocations.
| Translocations | Breakpoint on 10L | Average | Standard Error | Lin�s dataa |
| TB-10L3 | 0.33, 0.27, 0.35, 0.32, 0.29 | 0.31 | 0.03 | 0.61 |
| TB-10L7 | 0.50, 0.46, 0.52, 0.54, 0.47 | 0.50 | 0.03 | 0.77 |
| TB-10L8 | 0.36, 0.35, 0.25, 0.35, 0.46, 0.42 | 0.37 | 0.07 | 0.50 |
| TB-10L5 | 0.44, 0.51, 0.41, 0.48, 0.41, 0.46 | 0.45 | 0.04 | 0.61 |
| TB-10L10 | 0.37, 0.50, 0.39, 0.48, 0.33 | 0.41 | 0.07 | 0.65 |
| TB-10L13 | 0.58, 0.61 | 0.60 | 0.02 | ndb |
| TB-10L14 | 0.59, 0.71, 0.69, 0.73, 0.58, 0.67, 0.71 | 0.67 | 0.02 | 0.45 |
| TB-10L18 | Centromere | Centromere | - | 1.35 |
| TB-10L25 | 0.44, 0.56, 0.45, 0.46, 0.40, 0.49 | 0.47 | 0.05 | 0.67 |
| TB-10L28 | 0.53, 0.46, 0.41, 0.36, 0.49, 0.46 | 0.45 | 0.06 | 0.82 |
| TB-10L29 | 0.43, 0.37, 0.46, 0.40, 0.35, 0.37 | 0.40 | 0.04 | 0.39 |
| TB-10L31 | 0.65, 0.67, 0.65, 0.71, 0.65, 0.64 | 0.66 | 0.03 | 0.86 |
| TB-10L32 | 0.69, 0.59, 0.67, 0.73 | 0.67 | 0.06 | 0 |
| TB-10L34 | 0.59, 0.49, 0.53, 0.46, 0.61, 0.54 | 0.54 | 0.06 | 0.47 |
| TB-10L35 | 0.58, 0.46, 0.60, 0.56, 0.48 | 0.53 | 0.06 | 0.41 |
| TB-10L37 | 0.61, 0.64, 0.58, 0.57 | 0.60 | 0.03 | 0.63 |
| TB-10L38 | 0.60, 0.58, 0.56, 0.63, 0.67 | 0.61 | 0.04 | 0.54 |
aRecombination ratio of breakpoint-R/g-R
(from Lin, 1974).
bNo data.
Figure
1. Cytological 10L breakpoints of 26 B-10L translocations.
Return to the MNL 76 On-Line Index
Return to the Maize Newsletter Index
Return to the MaizeGDB Homepage