In the study presented here, we report further details about the quantitative genetic control over maysin, apimaysin and methoxymaysin, and chlorogenic acid. In particular, our results support the suggestion (Grotewold et al., 1998) that p1 regulates the gene(s) required for the synthesis of chlorogenic acid. We present the evidence that the patterns of effects of p1 and a1 on apimaysin and methoxymaysin were very similar or identical to those on maysin in the (GE37 x 565) F2 population. We also detected two chromosome regions near RFLP markers npi409 on the short arm of chromosome 5 and umc132a on the long arm of chromosome 6, respectively, which showed contrasting association with maysin and apimaysin and methoxymaysin, indicating that the syntheses of these flavonoids occur independently (Lee et al., Genetics 149:1997-2006, 1998).
The F2 population was derived from the cross between the inbred lines GE37 and 565. Inbred GE37 is a dent corn with a high concentration of C-glycosyl flavones (maysin, apimaysin and methoxymaysin) and chlorogenic acid in silk tissues. Inbred 565 is a sh2-sweet corn with essentially no C-glycosyl flavones and a low concentration of chlorogenic acid in silk tissues (Guo et al., J. Econ. Entomol. 92:746-753, 1999). The allelic constitution at the p1 locus is P1-wrb (white pericarp, red cob, browning silk) for GE37 and p1-www (white pericarp, white cob, non- browning silk) for 565. Our testcrosses with an a1 tester stock indicated that GE37 has functional A1 allele and 565 has a non-functional a1 allele at the a1 locus. The 304 F2 plants used in this study were derived from two self-pollinated F1 plants, 142 plants from one F1 and 162 plants from the other. Leaf tissue was collected from F2 individuals, and from GE37, 565 and F1 at the mid-whorl stage for DNA preparation. The collected silks were prepared for extraction of maysin, apimaysin and methoxymaysin, and chlorogenic acid. The concentrations of these chemicals was determined by reverse-phase HPLC, and expressed as percent fresh silk weight. Apimaysin and methoxymaysin were not separately measured, instead they were measured together in mixture. Hereafter, we abbreviate the apimaysin and methoxymaysin as am-maysin. One hundred and two DNA probes were screened against the DNA samples of GE37, 565 and (GE37 x 565) F1 digested with the 13 enzymes of ApaI, BamHI, BglII, Csp45I, DraI, EcoRI, EcoRV, HindIII, PstI, SalI, SspI, XbaI and XhoI. Probes which were polymorphic were used for genotyping F2 individuals.
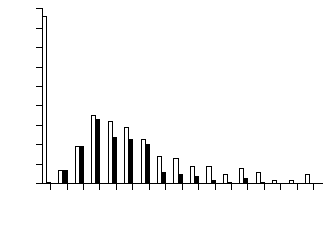
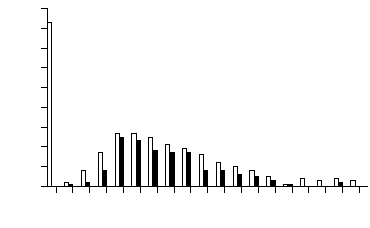
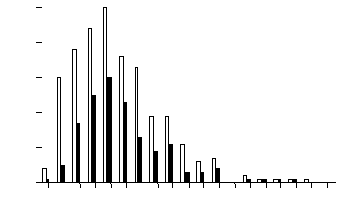
Distribution of F2 individuals over concentration of flavones (maysin or am-maysin) showed that a large number of individuals had an extremely low concentration of the flavones (white bars in Figures 1 and 2). To further analyze the distribution patterns, we examined only F2 individuals that were heterozygous at the p1 locus. The distribution of the p1-heterozygous individuals showed the absence of a large number of individuals with extremely low flavone concentration (black bars in Figures 1 and 2). All of the individuals with extremely low flavone (but not chlorogenic acid) concentration (white bars in Figures 1 and 2) were homozygous for the p1 allele from parent 565, and the number of these individuals was about 1/4 of the whole population (86/304 for maysin and 83/304 for am-maysin). Few F2 individuals had an extremely low concentration of chlorogenic acid (Figure 3). In all cases, a significant number of individuals were observed with higher chemical concentration than that of GE37, indicating a transgressive segregation occurred. The chromosome positions of p1, a1, npi409 and umc132a were confirmed on the short arm of chromosome 1, the long arm of chromosome 3, the short arm of chromosome 5 and the long arm of chromosome 6, respectively, by using MAPMAKER/EXP 3.0. In expressing the association between loci and chemical concentrations, multi-locus models were constructed in a stepwise way to best explain variation for chemical concentrations. The significant locus (p1) that had the highest R2 was included in the modelling. Then each of the remaining loci or markers was added, resulting in two-locus models from which the one was selected that had the highest R2 and in which both loci (p1 and a1) were significant. The interaction between the two loci (p1 and a1) was added to the model and it was observed that all three terms (p1, a1 and p1 x a1) in the model were significant (P<0.01). Each of the remaining loci or markers was added to the model, resulting in three-locus models from which one was selected that had the highest R2 and in which all terms (p1, a1, p1xa1 and npi409) were significant. Interaction between npi409 and p1 or a1 was not found to be significant. Due to the limited population size (304 individuals), three-way interaction was not tested, and no other locus or marker could be added to the model at 0.01 level. Therefore, for maysin the best multi-locus model included p1, a1, npi409 and p1x a1, accounting for 61.0%, 6.4%, 1.3% and 1.7%, respectively, and 70.4% in total of maysin variation (Table 1). Using the same procedure, the best multi-locus models were constructed for am-maysin and chlorogenic acid (Table 1). For am-maysin, the best multi-locus model included p1, a1, umc132a and p1xa1, accounting for 64.5%, 8.4%, 1.0% and 2.1%, respectively, and 76.0% in total of am-maysin variation. For chlorogenic acid, the best multi-locus model included p1 and a1, accounting for 12.5% and 4.7%, respectively, and 17.2% in total of chlorogenic acid variation.
We noticed that npi409 was included in the best multi-locus model for maysin, whereas umc132a was included in the best multi-locus model for am-maysin. To further show the associations of npi409 and umc132a with maysin and am-maysin levels, four-locus models including p1, a1, npi409 and umc132a were constructed for both maysin and am-maysin (Table 2). In the four-locus model for maysin, npi409 had significant association (P = 0.0059) with maysin, while umc132a had nearly no association (P = 0.7389) with maysin. However, in the four-locus model for am-maysin npi409 had nearly no association (P = 0.4829) with am-maysin, while umc132a had significant association (P = 0.0062) with am-maysin. Interactions involving npi409 or umc132a were not significant (data not shown) in these four-locus models.
At the p1 locus, mean maysin concentrations were 1.018%, 0.554% and 0.003% fresh silk weight for homozygous GE37, heterozygous GE37/565, and homozygous 565, respectively (Table 3), indicating that the effect of p1 on maysin was additive. At the a1 locus, the mean of the 565 homozygous class was higher than those of GE37/565 heterozygous and GE37 homozygous classes for both maysin and am-maysin concentrations, while there was no significant difference between the means of GE37/565 heterozygous and GE37 homozygous classes, indicating that a1 acts in recessive mode for high maysin and am-maysin. On chlorogenic acid a1 showed an additive effect. The genotype class means of p1 x a1 interaction showed that a1 increases maysin or am-maysin concentrations only when the a1 allele from 565 is homozygous and at least one p1 allele from GE37 is presented. The npi409 marker represents a locus that acts in recessive mode for high maysin, i.e. the mean of 565 homozygous class (0.620) was significantly higher than those of GE37 homozygous (0.471) or GE37/565 heterozygous (0.484) classes. The umc132a marker represents a locus that acts in an additive mode for am-maysin.
The F2 population of (GE37 (565) showed polymorphism at both the p1 and a1 loci, in contrast to the F2 population of (GT114 (GT119) reported by Byrne et al. (PNAS93:8820- 8825, 1996) that did not show polymorphism at the a1 locus. Using an F2 population derived from SC102 (high maysin dent corn) and B31857 (low maysin sh2 sweet corn) parents, Guo et al. (J. Econ. Entomol. in press, 2001) reported that p1 was not polymorphic in this population. A flanking marker npi286 to p1 corresponded with 25.6% of the silk maysin variance and a1 (accounted for 15.7% of the silk maysin variance) in this population (Guo et al., 2001). In the study reported here, we found further details about the roles of p1, a1, and the interaction between p1 and a1 in quantitatively genetic control over maysin, am-maysin, and chlorogenic acid, as well as confirmed that p1 and a1 are major QTLs controlling maysin concentration. Our results confirm the report by Grotewold et al. (1998) that p1 regulates the gene(s) required for the synthesis of chlorogenic acid. We present evidence that maysin and am-maysin synthesis share genes, including p1 and a1 in the (GE37 (565) population, in contrast to results with the population of (GT114 (NC7A) reported by Lee et al. (1998) in which the syntheses of apimaysin and maysin occurred independently. In addition, we detected two chromosome regions near RFLP markers npi409 on the short arm of chromosome 5 and umc132a on the long arm of chromosome 6, respectively, which showed contrasting associations with maysin and am-maysin, indicating that the syntheses of these flavonoids are independent.
Table 1. Multi-locus models of flavonoid
pathway loci or associated RFLP markers that best explained the variation
for maysin, apimaysin and methoxymaysin, and chlorogenic acid concentration
in the F2 population of (GE37 x 565).
| Locus/RFLP marker or interaction | Chromosome locationa | Significance | R2 b | Parent contributing higher value allele |
| Maysin | ||||
| p1 | 1S | P < 0.0001 | 61.0 | GE37 |
| a1 | 3L | P < 0.0001 | 6.4 | 565 |
| npi409 | 5S | P = 0.0027 | 1.3 | 565 |
| p1 x a1 | P = 0.0043 | 1.7 | ||
| Total | 70.4 | |||
| Apimaysin and methoxymaysin | ||||
| p1 | 1S | P < 0.0001 | 64.5 | GE37 |
| a1 | 3L | P < 0.0001 | 8.4 | 565 |
| umc132a | 6L | P = 0.0062 | 1.0 | GE37 |
| p1 x a1 | P = 0.0002 | 2.1 | ||
| Total | 76.0 | |||
| Chlorogenic acid | ||||
| p1 | 1S | P < 0.0001 | 12.5 | GE37 |
| a1 | 3L | P = 0.0005 | 4.7 | GE37 |
1The 1, 3, 5 and 6 are chromosome
number. S and L represent short arm and long arm of the chromosome, respectively.
2Percent chemical variation
explained.
Table 2. Contrasting associations of
npi409 and umc132a with maysin or apimaysin and methoxymaysin
in (GE37 x 565) F2 population.
| Locus/RFLP marker or interaction | Maysin | Apimaysin and methoxymaysin |
| npi409 | P = 0.0059 | P = 0.4829 |
| ucm132a | P = 0.7389 | P = 0.0062 |
| p1 | P < 0.0001 | P < 0.0001 |
| a1 | P < 0.0001 | P < 0.0001 |
| p1 x a1 | P = 0.0042 | P = 0.0002 |
Table 3. Levels of maysin, apimaysin
and methoxymaysin, and chlorogenic acid in the F2 population of (GE37 x
565).
| Locus/RFLP marker or interaction | Genotype1 |
(% silk fresh weight) |
(% silk fresh weight) |
(% silk fresh weight) |
| p1 | A |
|
|
|
| H |
|
|
|
|
| B |
|
|
|
|
| a1 | A |
|
|
|
| H |
|
|
|
|
| B |
|
|
|
|
| npi409 | A |
|
||
| H |
|
|||
| B |
|
|||
| umc132a | A |
|
||
| H |
|
|||
| B |
|
|||
| p1 a1 | A A |
|
|
|
| A H |
|
|
||
| A B |
|
|
||
| H A |
|
|
||
| H H |
|
|
||
| H B |
|
|
||
| B A |
|
|
||
| B H |
|
|
||
| B B |
|
|
*A, B and H represent homozygotes for
the GE37 allele, homozygotes for the 565 allele, and heterozygotes, respectively.
** Significant level is P <
0.01. Within each group of comparisons, means followed by the same letter
are not significantly different.
Figure 1. Frequency distribution of silk maysin concentrations in F2 population of (GE37 x 565). Black bars represent the F2 individuals that were heterozygous at the p1 locus. White bars represent the total 304 F2 individuals that were homozygous or heterozygous at the p1 locus.
Figure 2. Frequency distribution of silk apimaysin and methoxymaysin maysin concentrations in F2 population of (GE37 x 565). Black bars represent the F2 individuals that were heterozygous at the p1 locus. White bars represent the total 304 F2 individuals that were homozygous or heterozygous at the p1 locus.
Figure
3. Frequency distribution of silk chlorogenic acid concentrations in
F2 population of (GE37 x 565). Black bars represent the F2 individuals
that were heterozygous at the
p1 locus. White bars represent the total 304 F2 individuals that
were homozygous or heterozygous at the
p1 locus.
Return to the MNL 75 On-Line Index
Return to the Maize Newsletter Index
Return to the MaizeGDB Homepage