USDA-ARS and University of Georgia
COLUMBIA, MISSOURI
USDA-ARS
Dr. Bennetzen�s group has demonstrated microcolinearity in the sh2-a1 homologous regions of rice, sorghum, and maize (Chen et al., PNAS 94:3431-3435, 1997) and has completely sequenced this homologous region in rice (Chen and Bennetzen, Plant Mol. Biol. 32:999-1001, 1996) and sorghum (Chen et al., Genetics 148:435-443, 1998). A putative transcription factor gene X has been identified in this sh2-a1 homologous region in rice and sorghum in Bennetzen�s lab. At the nucleotide level, gene X of rice and gene X of sorghum share 82% identity of exons and 57% identity of introns. The order and orientation of the genes are conserved among rice and sorghum as demonstrated by Bennetzen�s group. The questions are whether gene X exists in maize and if so, where is its position in the maize genome.
To answer these questions, we used maize inbred SC102 and inbred B31857 in this study. The SC102 is a dent corn with A1/A1 genotype and high silk maysin concentration. Inbred B31857 with shrunken-2 (sh2) endosperm is an a1/a1 genotype and has no silk maysin (Guo et al., J. Econ. Entomol. 92:746-753, 1999). A pair of primers were synthesized based on the homologous region of gene X in rice and sorghum (Chen et al., Genetics 148:435-443,1998, GenBank accession number AF010283; Chen and Bennetzen 1996, Plant Mol. Biol. 32:999-1001, GenBank accession number U70541) and used to amplify maize genomic DNA. PCR was performed on 50 ng of template DNA, in a final volume of 50 µg containing 0.2 mM of each dNTP (Pharmacia), 0.3 µM of each primer, and 2.5 U of AmpliTaq Gold DNA polymerase (PE Applied Biosystems) in the buffer supplied by the enzyme manufacturer. The DNA amplification reaction was carried out using a GeneAmp PCR System 9700 Thermocycler (PE Applied Biosystems) under the following conditions: pre-PCR held 10 min at 94 C; PCR, 40 cycles of 45 s at 94 C, 45 s at 60 C, and 2 min at 72 C; post-PCR held 7 min at 72 C and kept at 4 C. We cloned the Taq-amplified PCR product using the TOPO TA Cloning Kit for Sequencing (Invitrogen, Carlsbad, CA). DNA sequencing was done using an ABI Prism-377 automatic sequencer. The search for homologous sequences at the GenBank databases was carried out using the BLAST program.
RT-PCR was done by the same primers using the Access RT-PCR system (Promega). Northern and Southern analyses were done by using the PCR product as probe to detect the gene X transcript and gene copy number. Probes were prepared by random-primer labeling of the template DNA with [a-32P]dCTP using the High Prime labeling kit according to the manufacturer�s instructions (Ambion). After hybridization, blots were exposed to a phosphor screen which was monitored using a PhosphorImager (Cyclone Storage Phosphor System) from Packard Instrument Company. The software package ImageQuant Version 3.3 from Molecular Dynamics was used to analyze and quantify the hybridization signals. To map this gene X in relationship with location of sh2 and a1, we used a F2 population (300 plants) derived from inbreds SC102 and B31857. Restriction fragment length polymorphism (RFLP) analyses were performed with probes specific for a1, sh2, and the cloned X-gene. The linkage analysis was done using the MAPMAKER program.
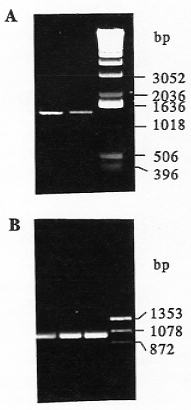
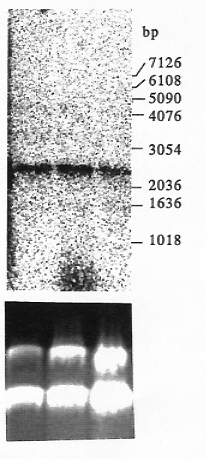
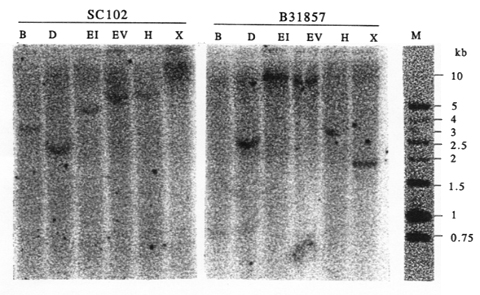
Using primers designed from gene X of rice and sorghum, we amplified and cloned a PCR product with molecular weight of 1.4 kb from maize leaves of SC102 and B31857 (Fig. 1A). The DNA sequence of the cloned PCR product has been deposited in GenBank database under accession number AF136530. This sequence has more than 90% and 80% homology with the 5'-end sequence of the putative X gene in sorghum and rice, respectively. Transcripts of the gene X in maize were detected by reverse transcriptase-PCR (Fig. 1B) with primers that yield a 1.4 kb PCR product from genomic DNA (Fig. 1A). We detected a gene transcript (1 kb) in leaves, cobs, and silks using RT-PCR (Fig. 1B). Northern analysis also revealed the X-gene transcript of about 2.3 kb in leaves, cobs, and silks (Fig. 2). This X-gene identified in maize is a single copy gene (Fig. 3). Mapping and linkage analysis showed this X gene is closely linked to loci of sh2 and a1, and placed in the same linkage group with sh2 and a1. Therefore, the X gene homologous to rice and sorghum exists in the maize genome. The position of the X gene in maize is closely linked with sh2 and a1 on chromosome 3. The functional feature of this X-like gene identified in sh2-a1 region in maize should be investigated in the future.
Figure 1. PCR (A) and RT-PCR (B) analyses, using the primers designed based on the sequences (GenBank accession number AF010283 and U70541).
Figure 2. Northern blot analysis of gene expression in leaf, cob, and silk. The blot was hybridized with the cloned PCR product (Fig. 1A). Equal loading was verified by visualizing rRNA in the gel stained with ethidium bromide (bottom).
Figure
3. Southern blot analysis of PCR clone with BamHI (B), DraI
(D), EcoRI (EI), EcoRV (EV), HindIII (H), or XbaI
(X) digested genomic DNA of maize.
Return to the MNL 74 On-Line Index
Return to the Maize Newsletter Index
Return to the MaizeGDB Homepage