Factors influencing efficiency of genetic mapping projects
--Wanous, MK; Snape, JW; Gustafson, JP
The development of restriction fragment length polymorphism (RFLP) and polymerase chain reaction (PCR) technologies have made it possible to construct highly saturated genetic maps as compared to maps utilizing classical morphological markers. Such maps have been constructed in human, as well as in model animal and plant species, and those of agricultural importance, including maize (Coe et al., MNL 69:247-267, 1995). Applications of molecular marker maps include gene tagging, analysis of synteny between species, analysis of quantitative trait loci, and map-based cloning. We have made some observations and calculations on strategies for map construction using different marker types and populations.
In constructing genetic maps, the amount of information generated depends on three factors: completeness of detection of recombinational events, linkage distance between loci, and number of individuals assayed. The first two factors are influenced by selection of parents for population construction and markers used. More polymorphism between parents and the utilization of more informative markers, increase the number of loci that can be mapped. Generally, the selection of parents for genetic map construction is optimized for maximum polymorphism between the parents. However, for specific applications such as gene tagging, where a specific population is used, the level of polymorphism may not be as high as for the initial mapping population. The recombination detected with different types of progeny populations varies.
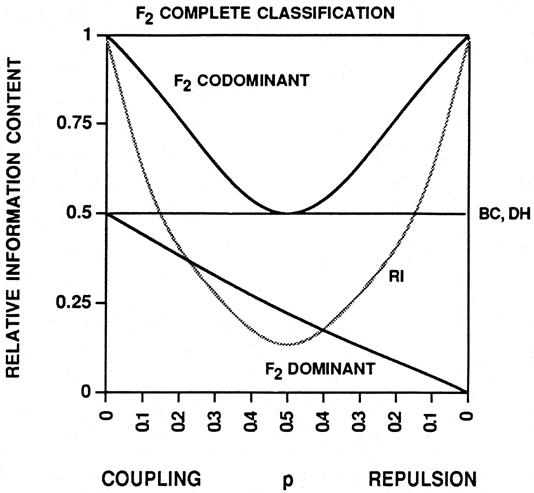
F2 individuals completely classified with respect to linkage phase provide, on average, twice as much information as backcross individuals (Fig. 1; Mather, The Measurement of Linkage in Heredity. Methuen & Co., London, 1938, 1957). This is intuitively clear, given that an F2 individual possesses two meiotic products at a given locus rather than one as with a backcross progeny. However, the efficiency of mapping codominant markers (e.g., most RFLPs) in an F2 population ranges between that of a completely classified F2 and a backcross, depending on distance between markers (Fig. 1). This is because, with an F2 individual, two meiotic products are observed simultaneously, and some ambiguity occurs in that Ab/aB (two recombinant gametes) cannot be distinguished from AB/ab (two non-recombinant gametes) without progeny testing. The probability of a crossover having occurred in a given interval on both homologs of an F2 is the square of the probability of the event occurring once, which is proportional to the genetic length of the interval. Thus, the efficiency of mapping with codominant markers in an F2 population approaches that of a completely classified F2 population as the linkage distance between markers decreases (Fig. 1).
Random amplified polymorphic DNAs (RAPDs; Williams et al., NAR 18:6531-6535, 1990) are more cost- and time-efficient than RFLPs for small sample sizes (Ragot and Hoisington, TAG 86:975-984, 1993). However, when mapping dominant markers, such as RAPDs, in an F2 population, the efficiency is less than in a backcross population, but approaches this level as the linkage distance decreases if markers are in coupling phase. Markers in repulsion phase are not very informative (Fig. 1). In practice, when mapping many markers in an F2 or backcross population, mixed linkage phases will be encountered. This will affect overall mapping efficiency depending on the number of dominant markers used. Efficient approaches for mapping RAPDs include using backcrosses, doubled haploid (DH) populations and recombinant inbreds (RIs). The information content of these population types with dominant markers is unaffected by linkage phase. RIs are more informative when the distance between markers is ? 12.5 cM (Taylor, Recombinant inbred strains: use in gene mapping, in: Morse (ed.) Origins of Inbred Mice, pp. 423-438. Academic Press, New York, 1978).
A backcross population is more informative when greater genetic distances are involved (Fig. 1). A DH population is genetically equivalent to a backcross population derived from backcrosses to a completely recessive parent: one meiotic event is analyzed per individual. DH and RI mapping populations possess an additional advantage in that once constructed, they represent a practically inexhaustible 'immortal' population that is easily maintained and distributed to many collaborators. This facilitates interval mapping of clones of interest by merely mapping them on the immortal population. The genetic location can then be determined in relation to all other markers that have been previously mapped in the population.
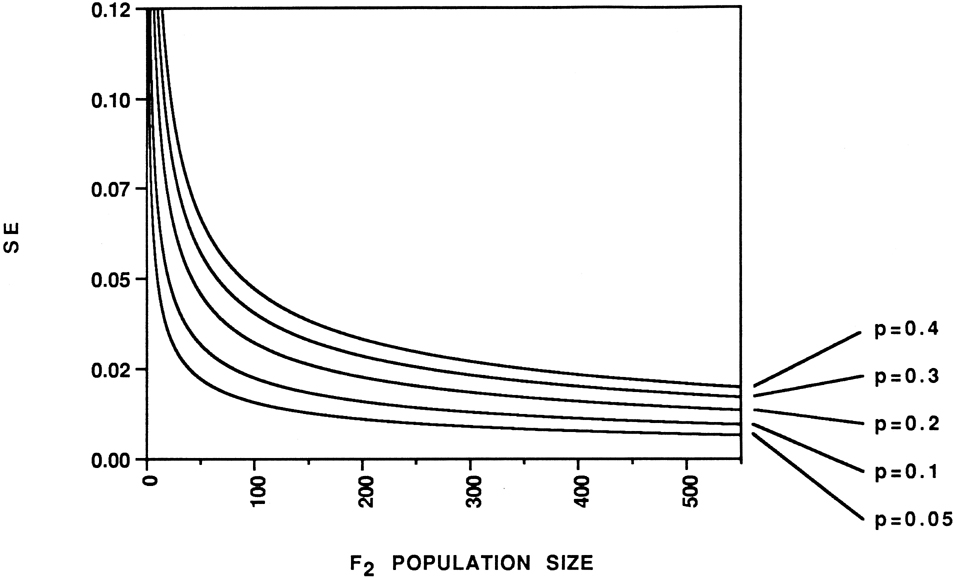
For a given interval, two factors determine the standard error (SE) of the recombination fraction estimate (p): the magnitude of p itself and the number of individuals in the population (Fig. 2). The average p value is a function of the number of markers mapped. Obviously, increasing the number of individuals assayed will decrease the SE of p. The desired precision of the p estimate determines the number of progeny that should be included in a mapping project. In Figure 2, with p = 0.1 the slope of the curve is -1.0 x 10⁻⁴ at n = 108; with p = 0.05 the slope of the line is -1.0 x 10⁻⁴ at n = 86. Above these progeny numbers there is a diminishing return in precision gained by additional progeny. As population size moves below these thresholds the SE begins to increase (precision decreases) at a greater rate.
In planning a mapping project there are several factors to consider: i) types of populations available in the species being studied; ii) type and number of marker that will be used; and iii) number of individuals to be included in the mapping population. These factors determine the information content, precision, cost and time efficiency in generating genetic maps and should be considered in designing mapping projects.
Figure 1. Relative information per individual (i) for different mapping population/marker type combinations. The population/marker type combinations are compared to the information content per individual of an F2 complete classification. Most RFLP markers are codominant. Most RAPDs are dominant markers. BC = backcross; DH = doubled haploid; RI = recombinant inbred. p is the recombination frequency. For F2 complete classification, i = 2/p(1-p). F2 with codominant markers, i = 2(1-3p+3p2)/p(1-p)(1-2p+2p2). BC and DH, i = 1/p(1-p). RI, i � 2/p(1+2p)2. F2 with dominant markers, repulsion phase, i = 2(1+2p2)/(2+p2)(1-p2). F2 with dominant markers, coupling phase, replace (1-p) for p in above equation. After: Allard (Hilgardia 24:235-278, 1956); Mather (The Measurement of Linkage in Heredity, Methuen & Co., London, 1938, 1957); Reiter et al. (PNAS 89:1477-1481, 1992). `
Figure 2. Standard error (SE) of recombination frequency (p) for codominant markers in an F2 mapping population. SE of p decreases as the number of individuals in the population is increased. SE of p decreases as p decreases, which, on average, is a function of the number of loci mapped. i = 2(1-3p+3p2)/p(1-p)(1-2p+2p2). SE = �[1/ni] where n = number of individuals in the family. Derived from Allard (Hilgardia 24:235-278, 1956).
Return to the MNL 71 On-Line Index
Return to the Maize Newsletter Index
Return to the MaizeGDB Homepage