Mapping of RAPD markers linked to chromosomal regions affecting sugar
accumulation in sugary enhancer sweet corn
--Katzir, N; Tadmor, Y; Juvik, J and Bar- Zur, A
The objective of our study was to map genes affecting characteristics associated with the se gene. RAPD analysis of NILs was used to identify putative informative primers. Two pairs of NILs (IL678a and IL451b), which differ for the se mutation, and IL677a, the original su1 se1 line, were compared. Three hundred and forty arbitrary, ten-mer primers were used to amplify the different genotypes. Of the 340 primers, only one, OPN20, generated an amplification product (675 bp long) which was present in all three su1 se1 genotypes, but not in their su1 Se isolines. Two primers, UBC281 and UBC425, generated products (900 and 700 bp, respectively) that were polymorphic between one pair of NILs (IL678a), but not between the other pair of NIL (IL451b). These two products were also produced by IL677a.
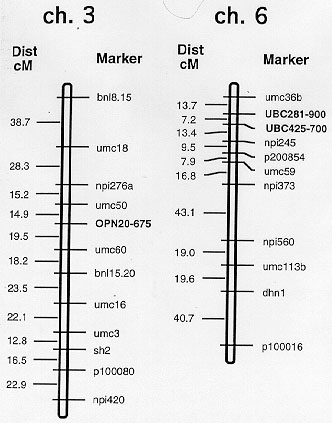
The three RAPD bands, described above, were mapped to chromosomes 3 and 6 adjacent to umc50 and umc59 respectively (Fig. 1) using the W6786 su1 Se x IL731a su1 se F2:3 population (Tadmor et al., Theor. Appl. Genet. 91:489-494, 1995). These regions were reported there as being associated with kernel sugar content. In that study the se1 locus was mapped to the long arm of chromosome 2 adjacent to umc36. Interestingly, all three RAPD markers were mapped to two chromosomal areas affecting sugar and taste (Azanza et al., Genome, in press), yet none was mapped to the se1 location on chromosome two. RFLP analysis of the same two pairs of NILs with umc36 did not detect polymorphism.
Elevated sugar content was one of the criteria in the development of the NILs and is a major characteristic by which se is selected in breeding programs. Our data indicate that more than one locus effects elevated sugar content in su1 kernels. This demonstrates the complication in the phenotypic selection for su1 se genotype and the advantage of Marker Assisted Selection for the se phenotype.
Figure
1. Chromosomal location of OPN20-675, UBC281-900 and
UBC425-700
(the second number is the size of the amplification product in bp).
Return to the MNL 70 On-Line Index
Return to the Maize Newsletter Index
Return to the MaizeGDB Homepage