Pachytene DAPI map
--R. Kelly Dawe, David A. Agard*, John W. Sedat* and W. Zacheus Cande
*Univ. Calif. San Francisco and Howard Hughes Medical Institute
Fluorescence microscopy has distinct advantages over traditional light microscopy in cytogenetic studies. Fluorescent DNA dyes (DAPI or Hoechst 33258) are simple to use, chromosomes can be viewed under conditions that preserve chromatin structure in a more life-like state, and data can be collected and analyzed in three dimensions (see Agard et al., Meth. Cell Biol. 30:353-377, 1989). We have prepared a linearized pachytene map as a first step in an effort to describe the spatial organization of chromatin during meiosis.
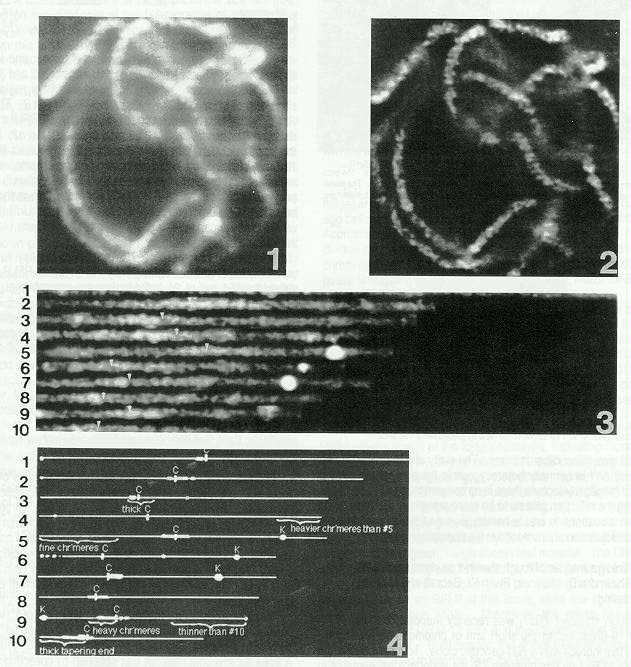
Nuclei from the inbred KYS were fixed with 4% paraformaldehyde in Buffer A (a buffer optimized to preserve chromatin structure, Belmot et al., J. Cell Biol. 105:77-92, 1987). A three dimensional data set was obtained by collecting serial fluorescent images at 0.25 micron intervals with a cooled charged coupled device (Fig. 1 shows a single image). The out-of-focus information was then removed using mathematical deconvolution. Figure 2 shows the effect of deconvolution on the single unprocessed image shown in Figure 1. Using the entire group of sections, the three dimensional path of each chromosome was traced and recorded. A radius of 0.8 microns was subsequently defined around the modeled chromosome paths, and computationally straightened. The linearized chromosomes were then displayed on a flat surface (Fig. 3).
Figure 4 shows the map of cytological features previously derived by McClintock, B, Longley and Kato from acetocarmine staining. The chromosomes were scanned directly from The Mutants of Maize (Crop Science Society of America, p. 4, 1968) and all of the relevant comments and the knobs found in KYS are shown. A comparison of the two maps reveals that many of the major features of the acetocarmine map are evident in chromosomes fixed in Buffer A and stained with DAPI. Good examples are the chromomere on 4S and heavy chromomeres on 4L, the thick tapering end of 10S and the general prevalence of centromeric heterochromatin.
Figure 1. Fluorescent image of DAPI-stained chromosomes from the inbred KYS. This image was recorded using a 60X objective.
Figure 2. Image in Figure 1 after three dimensional deconvolution of a series of optical sections taken at 0.25 micron intervals.
Figure 3. Chromosomes straightened from the same nucleus shown in Figures 1 and 2. Chromosomes are arranged with the short arms to the left. Centromeres are noted with arrowheads. The resolution in the Z dimension of the data set is low, and this is evident in some stretches of the chromosomes (i.e. distal short arms of chromosomes 1 and 5). The bright spot on the long arm of chromosome 9 is an artifact of one chromosome passing very close to another chromosome.
Figure 4. Acetocarmine map of cytological features. The chromosomes and relevant comments were scanned directly from Mutants of Maize. As in Figure 3, chromosomes are arranged with the short arms to the left. All of the knobs except those known to occur in KYS were removed.
Other features of the acetocarmine map are less obvious on the DAPI map. In addition, there are differences in chromosome length, and centromeres are less pronounced using DAPI (compare to the centromeres on p3 of Mutants of Maize). Some of these discrepancies may be explained by the difference in fixation procedures. By comparing the straightened chromosomes from a number of different inbreds, we hope to develop a high resolution map of the cytological features in DAPI-stained chromosomes.
Return to the MNL 66 On-Line Index
Return to the Maize Newsletter Index
Return to the MaizeGDB Homepage