We reported (MNL 61:72, 1987) a study to monitor variation in leaf polypeptide synthesis for various inbred and hybrid maize cultivars grown under different field management practices. The extraction, electrophoretic separation of polypeptides and fluorography of samples from 1985, 1986 and 1987 provide a large data set which has been analyzed using multivariate analysis techniques (Comput. Biol. Med. 17(1):29, 1987). These methods involve an eigenanalysis which defines and outlines trends in variation in any or all of the data subsets, e.g. cultivars, field plots, etc. Principal coordinate analysis summarizes variation found among the original data set variables and provides values which can be presented graphically as trajectory plots. Finally, a sum of squares clustering method was used to examine the grouping of individuals.
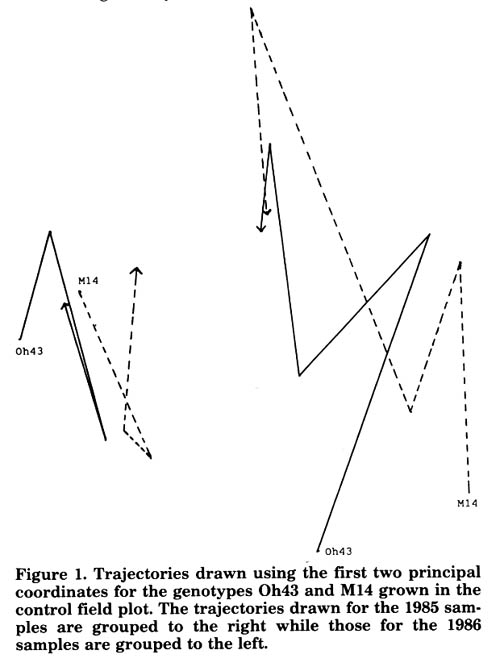
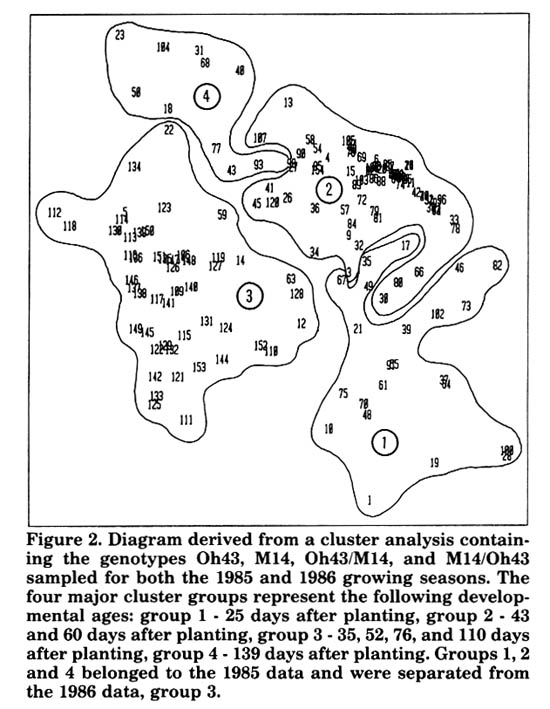
The study examined phenotypic (protein) variation among the various maize cultivars in an attempt to identify: 1) proteins that might be unique to cultivars; 2) proteins that might have a role in heterosis; and/or 3) proteins that might be of developmental significance. Approximately 5% of the polypeptides synthesized in the leaf tissue of different cultivars were found to be variable in expression and unique to specific cultivars and/or specific management plots. Principal coordinate analyses suggested that not necessarily the same polypeptides were varying in expression from 1 field season to the next since the trajectories for any 1 cultivar were separated by years (Figure 1). Polypeptide synthesis patterns throughout development show both similarities and differences between inbred and hybrid cultivars. Multivariate analyses led to the suggestion that groupings in the cluster analyses occur as a function of development (age) (Figure 2).
A subset of polypeptides was found to be expressed uniquely in certain inbred and hybrid cultivars. Heterosis was not fully described in terms of variant expression of polypeptides when inbred and hybrid genotypes were compared.
Figure 1. Trajectories draw using the first two principal coordinates for the genotypes Oh43 and M14 grown in the control field plot. The trajectories drawn for teh 1985 samples are grouped to the right while those for the 1986 samples are grouped to the left.
Figure 2. Diagram derived from a cluster analysis containing the genotypes Oh43, M14, Oh43/M14, and M14/Oh43 sampled for both the 1985 and 1986 growing seasons. The four major cluster groups represent the following developmental ages: group 1 - 25 days after planting, group 2 - 43 and 60 days after planting, group 3 - 35, 52, 76, and 110 days after planting, group 4 - 139 days after planting. Groups 1, 2 and 4 belonged to the 1985 data and were separated from the 1986 data, group 3.
T.G. Crowe and D.B. Walden
Return to the MNL 62 On-Line Index
Return to the Maize Newsletter Index
Return to the MaizeGDB Homepage