One of the major problems facing plant breeders is the complex genetic nature of most important agronomic traits. Examples of these quantitative traits include such whole-plant characters as stalk quality, disease resistance and grain yield. Maize breeders have been very successful at producing better inbreds using conventional genetic methods. Unfortunately, as more and more favorable alleles have been accumulated in their working germplasm, the effort required to carry all of them into the next inbred generation has increased. This is due to the fact that each new favorable allele often contributes only a few percent to the final whole-plant characteristic and therefore many plants must be screened and their phenotypes averaged to get reliable estimates of each genotype's worth. Recently developed methods using molecular markers offer a new approach to studying these complex traits. Instead of determining only the phenotype of the plant, it is now possible to determine the genotype as well. This means that for the first time, maize breeders have a tool that should allow them to follow the individual genetic components of complex traits. Earlier studies (for example see Edwards et al., Genetics 116:113, 1987) have shown the utility of co-dominant molecular markers (isozymes) in identifying quantitative trait loci (QTLs) and following their transmission in sexual crosses. These studies indicated the power of the technique but were limited by the relatively small number of markers available. RFLPs, because of the almost unlimited number available in any given cross, have the potential to provide the breeder with unprecedented and detailed knowledge about the maize germplasm pool. As an initial step in our study on the practicality of using RFLPs in maize breeding, we have identified and mapped QTLs for plant height and ear height.
Seed of the F2 of B73/Mo17 was planted in 1986. Each plant was self-pollinated to produce F3 ears. A winter nursery was used to produce seed for field testing. Twenty-four kernels from each of 112 F3 ears were planted in an isolated crossing block interplanted with rows of Pioneer inbred V78. This resulted in 112 F3 topcrosses to inbred V78. In addition, a separate 24 kernels from each F3 ear were planted, 10 individuals from each row selfed and the seed pooled. This produced the F4 bulks which were tested per se.
The F3 topcrosses were evaluated in field performance tests in 1987. Each of the F3 topcrosses comprised an entry in a randomized complete block design. The experiment was grown with 2 replications per location at 4 locations in central Iowa with each replication of an entry planted in a 2 row plot. The F4 bulks were tested identically except there were 3 test locations instead of 4; 2 locations in central Iowa and 1 in central Indiana.
Data were collected on the progenies rather than the original, individual F2 plants because the heritability of these complex traits is very low when measured on a single plant basis. Each trait is probably governed by more than one gene and expression is affected by environmental conditions. Thus, by testing F3 topcrosses and F4 bulks in replicated trials, a more accurate measure of phenotype was obtained. These measures of phenotype of F3 and F4 progeny were considered accurate estimates of the phenotype of each of the F2 plants from which they were derived.
Individual probes were hybridized to DNAs prepared from each of the F2 plants. Each plant was scored for its allelic composition at the locus defined by the probe. A genetic linkage map was constructed from these data by establishing linkage between pairs of RFLP marker loci by estimating the recombination values using the maximum likelihood method. Genetic linkage groups were assigned to chromosome arms by 1) using as probes DNA sequences whose location was known and/or 2) using as markers isozyme loci whose location was known. Linkage groups whose chromosomal location is unknown are indicated as Xn. Sixty-six markers were mapped to 10 linkage groups that cover approximately 50% of the genome.
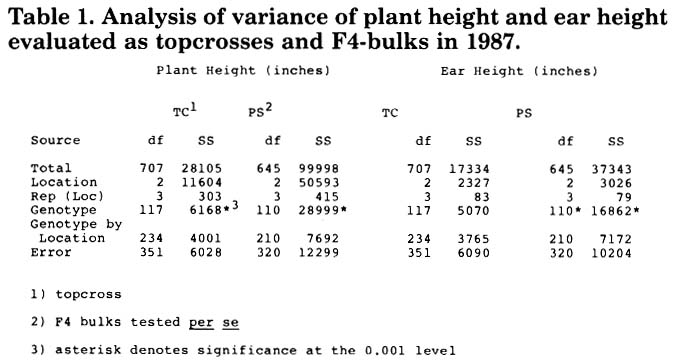
Plant height and ear height evaluated as topcrosses (TC) and F4-bulks (PS) showed significant variability among genotypes and no significant genotype by location interactions (Table 1). Both traits are highly heritable among the progeny from this cross: TC heritability = 0.68 or 0.63, PS heritability = 0.86 or 0.78 for plant height or ear height respectively.
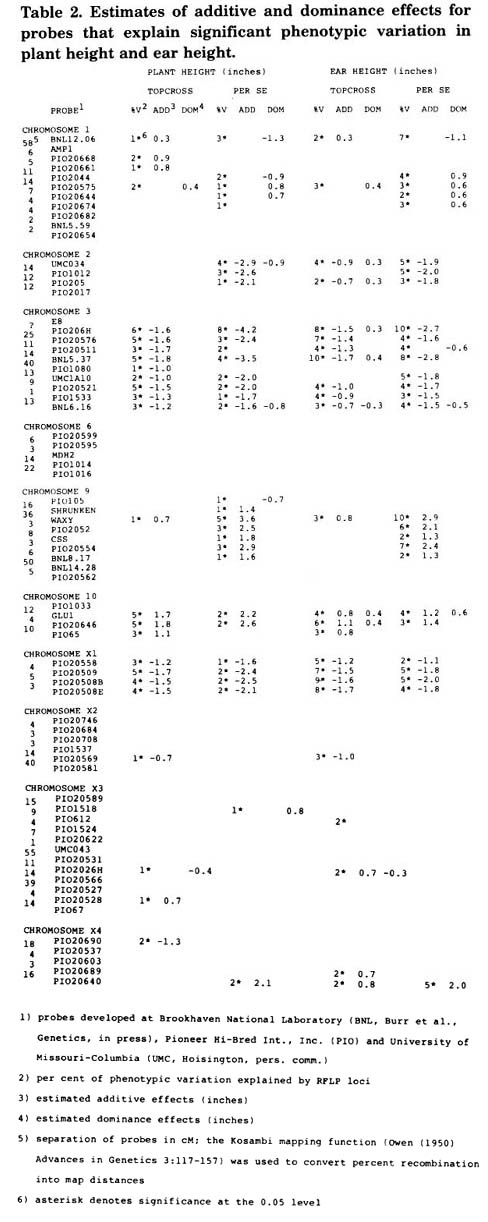
Averaged values (across reps) of plant height and ear height were used in a combined (across locations) single factor analysis of variance, which was calculated for each pairwise combination of plant height or ear height with marker locus. An F-test was used to determine if a significant (PR>F 0.05) amount of variability in plant height or ear height could be explained by the genotypic expression of each marker locus. Significant additive and dominance effects (PR>F 0.05) were estimated for QTLs that were associated with marker loci associated with plant height and ear height (Table 2).
Thirty-one and 29 marker loci explained a significant amount of the variability in expression of plant height and ear height in F4 bulks (PS) while these traits were associated with 25 and 23 marker loci, respectively, in F3 topcrosses (TC).
Based on linkage information and QTL expression of additive and dominance effects, we have identified 7 to 10 QTLs for both traits when evaluated as either TC's or PS. In general, the QTLs we have identified affect both plant height and ear height, although there are exceptions. For example, the QTL on chromosome 2 affects TC expression of ear height, but does not affect the TC expression of plant height. Most QTLs identified for topcrosses were the same as those identified for F4-bulks. The most obvious exception was the QTL near PI020554 on chromosome 9 that affected expression of both traits in PS tests, but neither trait when evaluated as topcrosses.
Our future work will first concentrate on filling in gaps in our RFLP linkage map. We also intend to expand our study of QTLs to include many of the agronomic traits that are of interest to maize breeders. Finally, we plan to evaluate the feasibility of using RFLP/QTL linkages to improve our ability to select for superior genotypes.
Table 1. Analysis of variance of plant height and ear height evaluated as topcrosses and F4-bulks in 1987.
Table 2. Estimates of additive and dominance effects for probes that explain significant phenotypic variation in plant height and ear height.
David Grant, Debi Blair, Wendy Behrendsen, Ruth Meier, Bill Beavis, Sue Bowen, Robin Tenborg, Joanie Martich, Rob Fincher, Stephen Smith, Howie Smith and Joe Keaschall
Return to the MNL 62 On-Line Index
Return to the Maize Newsletter Index
Return to the MaizeGDB Homepage