Initially, E4 [referred to as Est4 by A. L. Kahler (Jour. Hered. 74:239-246, 1983)] was placed near the centromere of chromosome 3 because of its linkage with the breakpoint of wx T3-9c (3L.09; 9L.12) (J. W. Harris, MNL 42:72-74, 1968). R. A. Kleese and R. L. Phillips (Genetics 72:537-540, 1972) further localized it to the middle of the short arm of chromosome 3 by virtue of its very close linkage to the breakpoint of T3-4(5156) (3S.47; 4L.67).
Our objective is to report linkage data on E4 with the chromosome 3 genes g2, d1, and gl6. A. L. Kahler has given details of the electrophoretic procedures (Crop Sci. 23:572-576, 1983) and allele (allozyme) nomenclature (Jour. Hered. 74:239-246, 1983) used for this report.
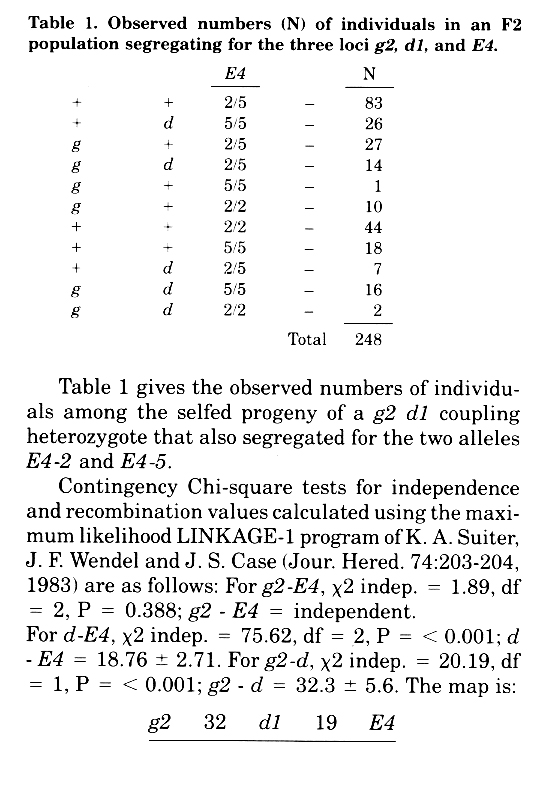
Table 1 gives the observed numbers of individuals among the selfed progeny of a g2 d1 coupling heterozygote that also segregated for the two alleles E4-2 and E4-5.
Contingency Chi-square tests for independence and recombination values calculated using the maximum likelihood LINKAGE-1 program of K. A. Suiter, J. F. Wendel and J. S. Case (Jour. Hered. 74:203-204, 1983) are as follows: For g2-E4, X2 indep. = 1.89, df = 2, P = 0.388; g2 - E4 = independent.
For d-E4, X2 indep. = 75.62, df = 2, P = < 0.001 d - E4 = 18.76 ± 2.71. For g2-d, X2 indep. = 20.19, df = 1, P = < 0.001; g2 - d = 32.3 ± 5.6. The map is:
g2 32 d1 19 E4
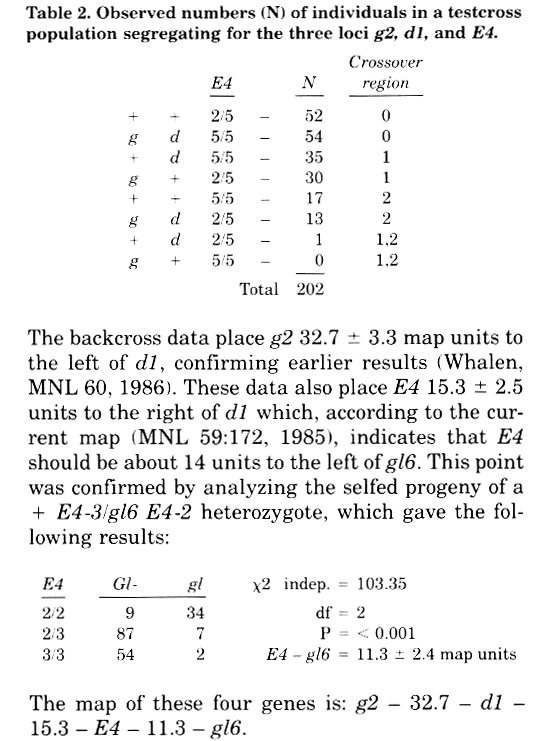
To verify the above map, we analyzed progeny of the testcross + + E4-2/g2 d1 E4-5 x g2 d1 E4-5, with the results as given in Table 2.
The backcross data place g2 32.7 ± 3.3 map units to the left of d1, confirming earlier results (Whalen, MNL 60, 1986). These data also place E4 15.3 ± 2.5 units to the right of d1 which, according to the current map (MNL 59:172, 1985), indicates that E4 should be about 14 units to the left of gl6. This point was confirmed by analyzing the selfed progeny of a + E4-3/gl6 E4-2 heterozygote, which gave the following results:
The map of these four genes is: g2 - 32.7 - d1 - 15.3 - E4 - 11.3 - gl6.
We thank Joanne Matthees for technical assistance in conducting electrophoretic assays.
Table 1. Observed numbers (N) of individuals in an F2 population segregating for the three loci g2, d1, and E4.
Table 2. Observed numbers (N) of individuals in a testcross population segregating for the three loci g2, d1, and E4.
R. H. Whalen and A. L. Kahler
Return to the MNL 60 On-Line Index
Return to the Maize Newsletter Index
Return to the MaizeGDB Homepage