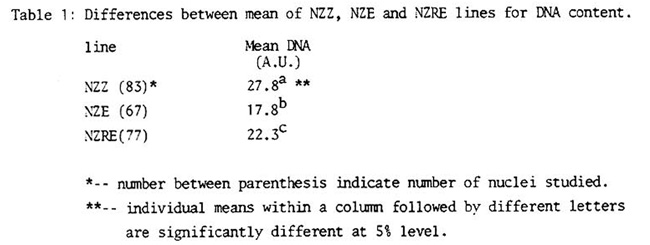
As previously communicated (MNL 55:51, 1981), the DNA contents in isogenic maize lines have been studied (Zea mays genotype). The test was practiced upon interphase nuclei of tapetum cells. Those lines possess the following constitution: Maize nucleus in its corresponding cytoplasm (NZZ), and maize nucleus in the cytoplasm of annual teosinte (NZE). A line was also analyzed with maize nucleus recuperated from annual teosinte cytoplasm to maize cytoplasm (NZRE) (Mazoti, Rev. Inv. Agr. 8:175, 1954). The three previously mentioned lines present highly significant differences for DNA contents, as can be observed in Table 1.
Owing to the fact that an interphase nucleus population has been analyzed for each line, the DNA values would normally have to vary between 2C and 4C pre- and post-synthesis, respectively.
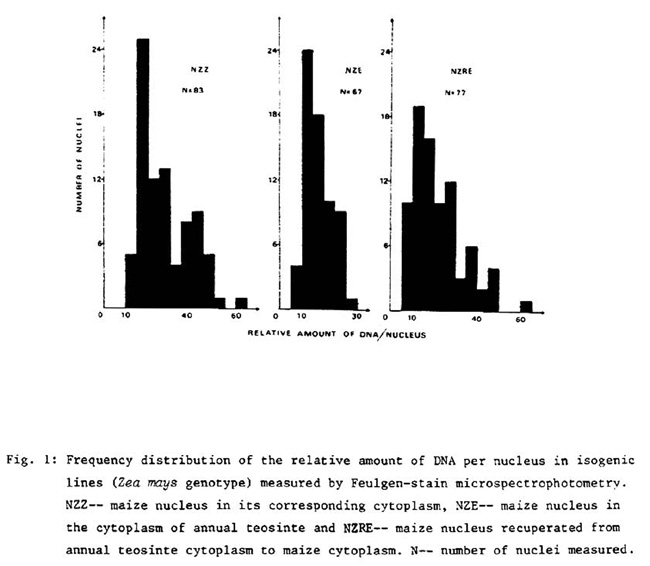
The distribution of frequencies for the DNA contents of the NZZ line adopts the classical bimodal distribution for interphase nuclei (Fig. 1). The first mode (with a higher 2C frequency) represents DNA pre-synthesis and the second mode (with a lower 4C frequency) represents DNA post-synthesis. In the NZE line, the 2C nucleus proportion is maintained the same as in the NZZ line, and there are no 4C nuclei to be found. The frequency distribution for DNA contents in the NZRE line is characterized by the appearance of 4C nuclei.
In accordance with the results obtained, it is interesting to point out the imbalance manifested in the proportion of nuclei present in each period (pre- and post-synthesis periods), when the same maize nucleus is subject to different cytoplasm. The DNA distribution is normal for those nuclei that are found in their corresponding cytoplasm (NZZ), and varies when the nuclei are present in a foreign cytoplasm like the one of annual teosinte (NZE). Finally, it is interesting to point out how a normal tendency in the nucleus distribution is manifested, when transferred from the foreign cytoplasm to its original cytoplasm; that is to say, when rescued to their normal cytoplasm.
As the nucleus analysis was made on a specimen taken at random, the distribution according to the period must be the same in all three lines studied. Therefore, the differences in the average DNA content between lines must be attributed to the different nucleus frequency in each of the periods (G1 and G2), and probably there consequently exists a cytoplasmic control in the nucleus frequencies corresponding to each period.
Table 1: Differences between mean of NZZ, NZE and NZRE lines for DNA content.
Fig. 1: Frequency distribution of the relative amount of DNA per nucleus in isogenic lines (Zea mays genotype) measured by Feulgen-stain microspectrophotometry. NZZ-- maize nucleus in its corresponding cytoplasm, NZE-- maize nucleus in the cytoplasm of annual teosinte and NZRE-- maize nucleus recuperated from annual teosinte cytoplasm to maize cytoplasm. N-- number of nuclei measured.
Ida Graciela Palacios
Return to the MNL 57 On-Line Index
Return to the Maize Newsletter Index
Return to the MaizeGDB Homepage