The rates of mutation induced by ionizing radiation differ greatly among organisms. The induced specific locus mutations per locus per rad ranges from 1 x 10⁻⁹ in bacteria to 5 x 10⁻⁶ in angiosperms. In 1973 Abrahamson, Bender, Conger and Wolff (Nature 245:460) discovered a direct correlation between radiation-induced mutation and the DNA content per haploid genome. This correlation has been commonly referred to as the ABCW relationship. Their survey of the literature encompassed data from prokaryotes, lower eukaryotes and higher eukaryotes. The ABCW relationship suggests that it is the nucleus, not the gene locus, that determines the size of the target for mutation. J. A. Heddle and K. Athanasiou (Nature, 1975, 258:359) suggested three explanations for the ABCW relationship. These are: (1) the target for mutation is proportional to the haploid DNA content of the nucleus, (2) the DNA repair efficiency is inversely proportional to the genome size, and (3) the size of the mutational event is proportional to the size of the genome. The concept of the ABCW relationship has been the subject of controversy. Schalet and Sankaranarayanan doubt that the relation is valid (Mutation Res., 1976, 35:341; Mutation Res., 1978, 49:313):
We compared the rate of forward mutation in maize induced by ionizing radiation with the ABCW relationship. Mutation was induced at the yellow-green-2 (yg2) locus with gamma radiation. Kernels heterozygous at the yg2 locus were soaked for 72 hr in aerated distilled water at 20 C. The kernels were irradiated with various doses of gamma rays. The kernels were planted and yellow green sectors were scored in leaves four and five. The doses of gamma radiation used were 0 (control), 50, 100, 250, and 500 rads. The response in this dose range in terms of the mean frequency of yellow green sectors per leaf four was 0.11, 0.60, 1.06, 4.00, and 9.19, respectively. The mean frequency of sectors for leaf five was 0, 0.07, 0.23, 0.78, and 1.22, respectively. A complete discussion of the experiment is presented in the accompanying note by Plewa.
In these experiments and in the interpretation of the dose response data we make the following assumptions. (1) A yellow green sector is the result of the loss of the Yg2 allele. The term "forward mutation" is used to describe the loss of the phenotype of the dominant allele (Yg2). We realize that this may be due to a terminal deletion on chromosome 9 that includes the yg2 locus or to a true point mutation at the yg2 locus. (2) A single yellow green sector is due to a single mutational event. (3) The number of targets for mutation (loci) is equal to the number of cells in the leaf four primordium (3,000) and leaf five primordium (500) at the time of irradiation.
From the above data we calculated the induced forward yg2 mutations per locus per rad (m) according to equation (1).
m = Si/No)(r) (1)
where Si is the frequency of induced mutant sectors, No is the number of target or primordial cells for a specific leaf at the time of irradiation, and r is the dose of gamma rays in rads.
The frequency of induced mutant sectors was calculated by equation (2).
Si = St - Sc (2)
where St is the mean frequency of mutant sectors per specific leaf at a specific dose of radiation and Sc is the mean frequency of sectors per leaf from the relevant control (0 rads).
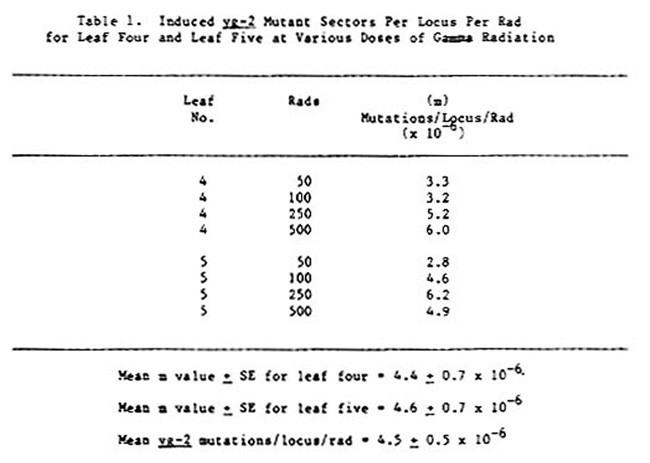
The induced mutant sectors per locus per rad for leaves four and five for each dose of radiation are presented in Table 1. The mean and standard error of the mean of yg2 mutations per locus per rad was calculated to be 4.5 + 0.5 x 10⁻⁶. Note that the calculated mean m values for leaf four and leaf five were very similar (4.4 x 10⁻⁶ and 4.6 x 10⁻⁶, respectively).
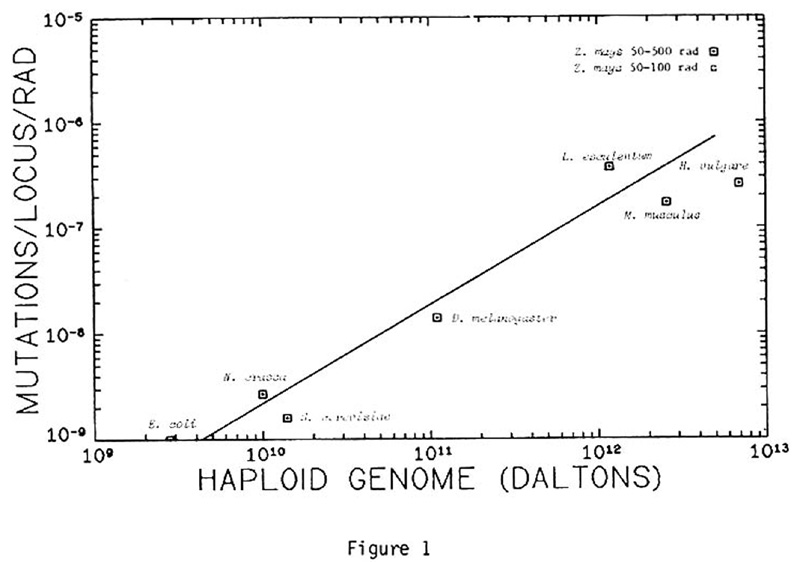
We compiled data from the papers of Abrahamson et al. (1973) and Heddle and Athanasiou (1975) and replotted the haploid DNA content vs. forward mutation per locus per rad (Figure 1). The correlation expressed graphically in Figure 1 is the ABCW relationship. To determine if the ABCW relationship was supported with the data we obtained on induced mutation at the yg2 locus by gamma radiation, we plotted the position for maize. The DNA content per haploid genome of maize is 5 x 10¹² daltons and the mean m value for the yg2 locus is 4.5 x 10⁻⁶.
In Figure 1 two points are plotted for maize, one that includes the data for 50 to 500 rads and one that includes the data from 50 to 100 rads only. The best fit of a curve that represents the relationship between the mutation rate and the size of the haploid genome was demonstrated by the method of least squares on the logarithms of the data. The curve represents a fit to the equation y = axb where y is the mutation rate and x is the size of the genome. The curve plotted in Figure 1 has the parameters of a = 1.15 x 10⁻¹⁸ mutations per locus per rad per dalton and b = 0.93. The coefficient of determination of linearity (r 2 ) is 0.89. The maize data (50 to 500 rads) were included in this fit of the curve.
The deviation of the point for maize is obvious. This may be due to a number of factors. The data used by Abrahamson et al. were based on X-ray induced mutations, while our data were generated with gamma rays. Since the LET and RBE for X and gamma rays are similar we believe it reasonable to plot the maize data in this comparison. The loss of the dominant phenotype, green leaf, in a yellow green sector can be due to a point mutation or to a chromosome deletion. The data for maize involve both events. It would be interesting to speculate how much the point for maize would be lowered if it was possible to differentiate the sectors that were due to chromosome deletions that included yg2 and point mutations at the yg2 locus. Finally, it must be stressed that all of the points represented in Figure 1 were derived from the literature, while the maize data were generated as an experimental test of the ABCW relationship.
We conclude that the data generated at the yg2 locus with ionizing radiation support the ABCW relationship. This indicates that induced mutation rates observed in angiosperms may not be significantly higher when compared to other organisms if the number of target loci and the haploid DNA content per cell are considered. (This research was funded, in part, by NIEHS Grant No. ES01895 GEN.)
Michael J. Plewa, Patrick A. Dowd, William E. Schy and Elizabeth D. Wagner
Return to the MNL 57 On-Line Index
Return to the Maize Newsletter Index
Return to the MaizeGDB Homepage