Cytological information has been obtained on several B-A chromosome translocations. Variable amounts of data are presented relative to one or both breakpoints in eight different B-A translocation stocks.
Good pachytene preparations were made using techniques that are somewhat different from conventional methods. Squashes were made in the usual way, but they were stained with propionic carmine for a very short period of time. This was followed with an exaggerated destaining process. In some cases, the destaining included running 45% acetic acid under the cover glass and through the cellular material of the squash. The objective was to obtain very light or understained material. These preparations were then observed with phase contrast microscopy. The combination of light staining and phase contrast usually resulted in good views of the pachytene chromosomes. In some cases, excellent observation could be made of chromomeres. In addition, the centromeres were often pronounced with this technique. This latter observation can be a very important factor in the characterization of B-A translocation stocks, since measurements have to be made, in most cases, without the aid of cross-configurations. It is feasible that other cytological studies may be accomplished using these techniques; in particular, cytological mapping of the maize genome with high resolution. Also, heteromorphic non-sister chromatids could occasionally be discerned in these preparations. The entire technique is presently being quantified.
The determination of breakpoints in hyperploid stocks with translocations between B and A chromosomes was found to be a different kind of challenge than breakpoint analyses of A chromosome translocations. Good cross-configurations were almost impossible to find. Most pachytene cells showed separate associations of BABA and ABA figures, rather than a complex of 4 chromosomes. A second concern in translocation breakpoint analyses has always been an inability to place a measure of confidence on the estimates because ratios cannot be handled by the usual statistical applications.
Attempts have been made to overcome some of the problems mentioned above. Firstly, the cytological technique described above was used in which greater resolution of chromomere patterns and centromeres was possible. Photomicrography was then employed to rapidly gain a recording of each figure encountered. Negatives were developed in a manner to enhance contrast. The negatives were placed in an artigraph instrument (generally used in cartography) and projected onto a large white surface. The very large images that were gained by this procedure could be directly analyzed. A cartographic map measurer was used to measure the various chromosome regions that could be recognized with some confidence. In most cases, the points of chromosome exchange could be discerned. This was facilitated by the very heterochromatic condition of the B chromosome and good resolution of chromomeres, centromeres, and other cytological landmarks. Although the measurements of the chromosome regions on the enlargements were in centimeters, they can be considered as arbitrary units since the objective is to gain ratios. All measurements were made at identical instrument settings. The technique is fast, and it has fairly good precision.
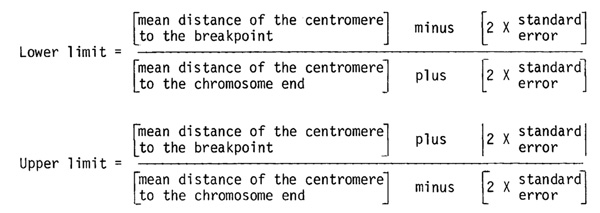
Several different mathematical treatments can be used to gain confidence intervals: (1) use of extremes; (2) standard error of the difference between means; and (3) the approximate variance of the error of the ratios. In this report, the use of extremes has been used. This calculation is the most conservative method, giving the largest confidence interval. All three methods have been discussed and applied in an example in the 1981 MGCNL. The use of the extremes method for calculating a confidence level of approximately 95% is as follows:
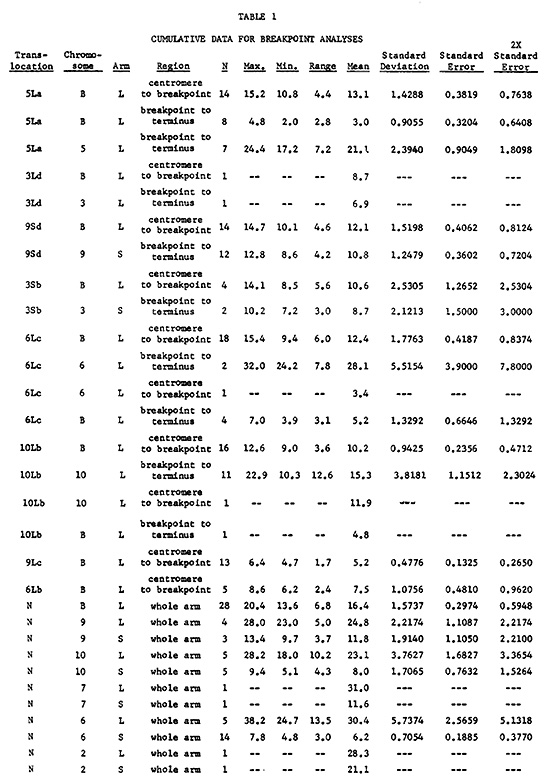
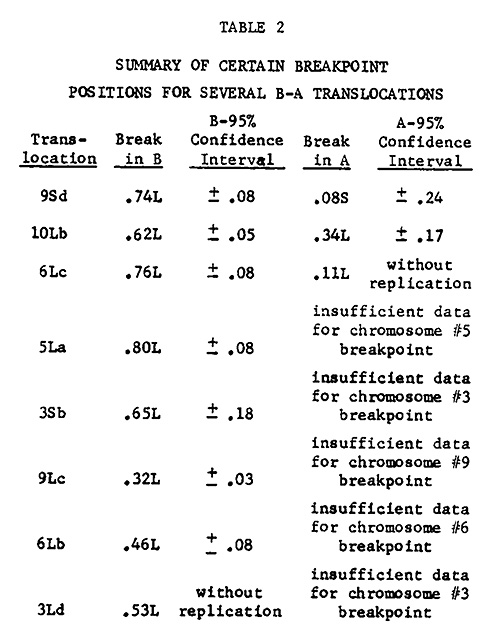
Table 1 lists the cumulative data gained thus far for breakpoint analyses. Table 2 displays a summary of some of the breakpoint positions based on these data. A total of 203 measurements were made to generate the calculations in these tables. Efforts are presently being made to gain additional measurements where data are completely lacking or insufficient.
Richard V. Kowles and Jack Beckett
Return to the MNL 56 On-Line Index
Return to the Maize Newsletter Index
Return to the MaizeGDB Homepage