The determination of breakpoints in hyperploid stocks with translocations between B and A chromosomes can be a different kind of challenge than the breakpoint analyses of A chromosome translocations. In cytological studies of different hyperploid stocks containing B-A translocations, good cross-configurations were almost impossible to find. In fact, most of the pachytene cells showed separate associations of BABA and ABA figures, rather than a complex of the four chromosomes. A second concern in translocation breakpoint analyses of any type is the usual inability to place a measure of confidence on the estimates. Often, the cytologist is fortunate to obtain one good cross-configuration, or very few of them. Even if a number of measurements can be made, ratios are being calculated and reported. Ratios cannot be handled by the usual statistical tests.
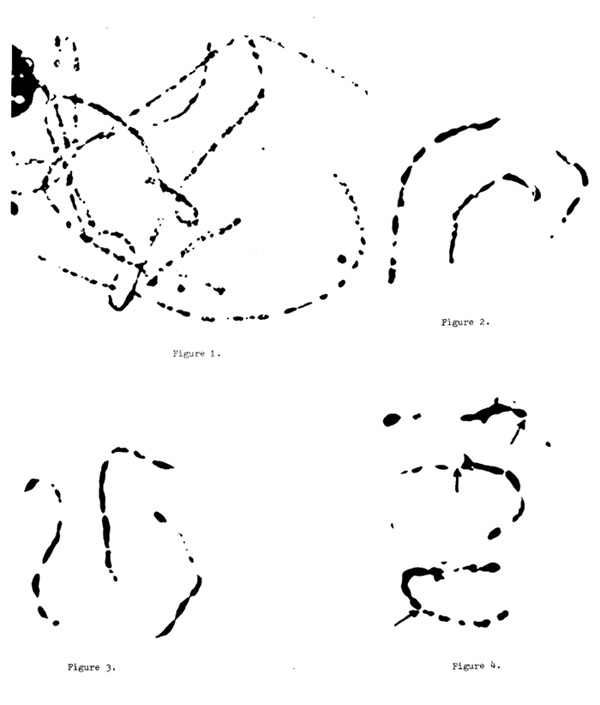
The following discussion outlines some attempts to overcome all three of the problems mentioned above. Firstly, a cytological technique was needed in which the pachytene chromosomes could be observed with enough resolution to discern the points of exchange without cross-configurations. Briefly, squashes were made with propionic carmine followed by an exaggerated de-staining process. Combined with phase contrast microscopy, one consistently obtains preparations which show very distinct chromomere patterns. Photomicrography and printing upon ultra high contrast paper yield the desired results (See Figure 1). A more detailed description of the entire technique will be reported later.
An example of the method for calculating the breakpoints and providing confidence intervals will be given for the TB-10Lb stock. Figure 2 shows several of many photomicrographs obtained of the normal B and Figure 3 shows several photomicrographs of the normal chromosome 10. The B10B10 figures are much easier to find in hyperploid stocks than the 10B10 figures. Actually, the B10B10 figures are so conspicuous that one can usually obtain numerous observations of at least part of the configuration. Figure 4 shows several of many representative B10B10 figures with the probable breakpoints indicated by arrows.
Measurements were made of the various chromosome regions by utilizing photomicrography, enlargement onto printing paper, and measuring with a cartographic map measurer. Identical conditions and magnifications were used throughout. The pertinent measurements needed are actually the result of different figures in different cells, and in some cases, in different squash preparations. Nonetheless, one can generate an abundance of data with relative ease, and therefore, calculate means for the lengths of the various regions. For an example of the precision, six different B chromosomes measured in this manner gave the following measurements in arbitrary units: 9.1, 9.0, 9.2, 9.1, 8.4, 9.9. In conclusion, the lack of cross-configurations is overcome by chromomere pattern analyses, and the rarity of cells distinctly showing all of the pertinent regions is overcome by gaining many figures of each component, and then calculating the means. These steps also tend to overcome the problems of non-homologous pairing, synapsis, and other cytological discrepancies.
Lastly, several statistical techniques can be used so as to place confidence intervals with the results. Again, the data obtained for the TB-1OLb stock will be used as an example. Measurements were made for both the B chromosome and the chromosome 10 regions. Those of the B chromosome will be shown as representative of the technique.
B chromosome calculations (means and standard errors):
Centromere to breakpoint: 7.1 units ± .3344 (n=15)
Centromere to chromosome end: 8.9 units ± .2169 (n=6)
Breakpoint location = 7.1/8.9 = .80
Several different methods might be used for calculating a confidence interval for a ratio:
Method I (use of extremes):
Lower limit = (7.1 - .3344)/(8.9 + .2169) = .7421
Upper limit = (7.1 + .3344)/(8-9 + .2169) = .8562
It can be stated that at least 68% of the means would fall within the ratios of .7421 and .8562. For various mathematical reasons, this is a conservative interval. However, one can also relate the breakpoint ratio to the standard error of the difference of means through the use of the square root law. This calculation is slightly less conservative.
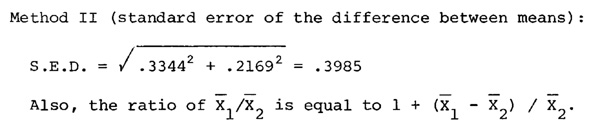
Method II (standard error of the difference between means):
By inserting the difference between the means (X1 - X2) with the calculations, one can again calculate the upper and lower limites:
Lower limit = 1 + (-1.8 - .3985)/(8.9 - .2169) =
.7467
Upper limit = 1 + (-1.8 + .3985)/(8.9 + .2169) =
.8462
Note that these results are slightly tighter than those from above. Again, it can be stated that at least 68% of the means will fall within the ratios of .7467 and .8462.
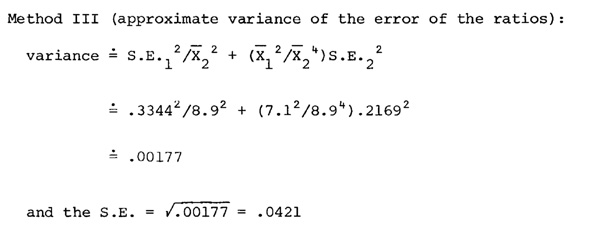
Method III (approximate variance of the error of the ratios):
In summary,
| Lower limit | Upper limit | Size of Interval | |
| Method I | .7421 | .8562 | .1141 |
| Method II | .7467 | .8462 | .0995 |
| Method III | .7579 | .8421 | .0842 |
The pattern that occurs is obvious., Method III, of course, yields the smallest confidence interval and should be preferred. If a 95% confidence interval is desired, the same method can be used with the S.E.'s simply multiplied by 2. And the breakpoint in the other chromosome can be calculated next in the same way.
A total of 255 photomicrographs of 10 different TB stocks are presently being analyzed using these procedures. These data will be reported at a later time. These techniques might also be useful for the standard A translocation analyses.
Richard V. Kowles and J. B. Beckett
Return to the MNL 55 On-Line Index
Return to the Maize Newsletter Index
Return to the MaizeGDB Homepage