Utilizing the above procedures, it is possible to visualize proteins as stained spots on the electropherogram surface. Due to the small size of the gels produced, stained proteins are not easily resolved with the unaided eye or conventional densitometry. A high resolution densitometer is required before maximum information can be obtained. Some two-dimensional densitometry equipment can discern variation in optical density of photographic films in 1 square micron areas. Due to the nature of the scanning method engineered into the Optronix-100, direct densitometry of gels was impossible. The machine requires a flexible photographic image for scanning. The image is mounted on a rotating drum. An output of discrete intensity value is achieved by focusing a beam of light through the image onto a photodetector, at a position in the image defined by translation of the beam (x) and rotation of the drum (y). The output is in the form of a binary coded magnetic tape. Computer analysis facilitates the graphic and enumerative representation of the number of protein species, relative quantity, charge and molecular weight into patterns or protein "landscapes." Such landscapes with the activity of specific genes (i.e. the "landmarks") allow the production of a genetic/biochemical "map," to "chart" the "latitude" and "longitude" of growth, development and determination of any biological tissue.
Photography of gels: The stained gel is photographed with fluorescent back light, 12 hours after fixation, with a 35 mm Pentax Camera, 35 mm wide angle lens, and a focal distance of 3 inches, and the image is produced on Kodak High Contrast Copy Film (ASA 50). The film is developed for 7 minutes at 200 C in Kodak Microdol X (diluted 1:1 with distilled water), fixed for 10 minutes in Kodak Fixer and treated for 1 minute with a 1:1000 dilution of Kodak Photoflow surfactant. A 16 x 20 cm positive enlargement of the negative image is produced on Kodak Professional Fine Grain film. The film is developed for 2 minutes at 200 C in Kodak Dektol (diluted 1:3 with distilled water) and fixed as before.
Densitometry of gels: The enlargement is scanned with the Optronix 100 at the sequential x and y increments of 200 microns. Each 3 micron square gel area is interpreted as a 2 mm square photographic representation. The digitized density, ranging from 0 (lightest) to 255 (darkest), and coordinated values are output to a nine track magnetic tape. The format of the output file is 700 records (each representing one 200 micron step in the x direction) containing 800 (successive 200 µ steps in the y direction) eight-bit octal numbers. Each number (ranging from 0 to 255) represents the intensity of one 200 micron square of the gel. These raw data are then translated by suitable FORTRAN language programs with a Control Data Corporation CYBER 73 computer to a disk device output file. The output file is represented in the computer as a two-dimensional matrix (x and y) such that each cell in the matrix contains a single intensity value. The matrix usually consists of some 560,000 elements. The data may now be discretized by applying the function f(x,y) as a descriptor of intensity. Such a function is integratable and may be ascribed integer limits (0 < f(x,y) < 255).
Having established the means to enumerate and represent the electrophoretic gel as a digital density surface, the aim of subsequent metrification is to reveal some form of identification pattern within the surface. This first step in image segmentation is based on analysis of each matrix cell. Summing the number of occurrences of each density level in the image matrix and dividing by the total number of matrix elements allows the construction of a frequency-gray level histogram.
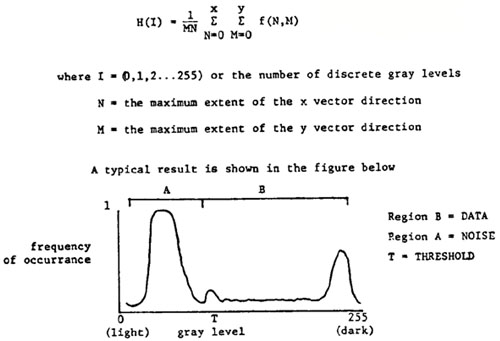
The data for the histogram are obtained by applying the following equation:
This type of intensity distribution is typical of a positive gel image (i.e. dark spots on a light background). Within the distribution, a single density value (T) may be selected as a threshold value. The selection of a threshold allows the reduction of the amount of information required to describe the edges of resolved protein spots in the electrophoretic gel. The raw data matrix may be subdivided into two major components: values above T (region B), considered valid protein data descriptors; and values below T (region A), considered as experimental and machine noise/artifacts. The value of T is arrived at by operator intervention. Having achieved a T value, the density matrix within the computer is subdivided into 40 or more 100 x 100 point sequential matrices which we have termed R matrices. A corresponding set of 40 matrices (termed T matrices) are also constructed where those intensity values below the value of T are scored as zeroes, those above T are unaltered. Therefore, the edges of protein spots within a gel image can be discretely bound mathematically.
The edges of the figures described within such T matrices are then plotted with the aid of a drum plotter (Calcomp, Anaheim, CA) or displayed on a graphics monitor device (Tektronix, Beaverton, OR). This output result (a contour map) can then be compared visually to the original gel image. Having obtained contours which reasonably describe the original proteins resolved in the gel, a maxima-minima algorithm is applied to the data enclosed by each contour. In this way, single co-ordinated pairs may be used to describe protein-spot-overlaps. The co-ordinates define the isoelectric point and the molecular weight for each protein. The above results are plotted as a three-dimensional graph of the electropherogram surface (x = pH, y = molecular weight and z = relative intensity).
The raw data, T matrices, contour plot data and three dimension graphic coordinates are then stored on magnetic tape for future reference. Employing such methods of analyses, we have been able to detect some 190 different proteins in a single electrophoretic gel where conventional densitometry or the human eye showed less than 75 species.
The technique is useful in situations which require the transformation of a complex visual image into a simple enumerative data base.
W. G. Hughes
Return to the MNL 54 On-Line Index
Return to the Maize Newsletter Index
Return to the MaizeGDB Homepage