Maize Genetics Cooperation Newsletter vol 84 2010
Please Note: Notes submitted to the Maize Genetics Cooperation Newsletter may be cited only with consent of authors
KEW, UK
Royal Botanic Gardens, Kew1
SAINT PAUL, MINNESOTA, USA
University of Minnesota2 and USDA-ARS3
Metaphase I pairing of B-chromosomes of Zea mays L. in the alien genetic background of Avena sativa L.
––Kynast RG1, Joseph JA1, Phillips RL2 and Rines2, 3
Introduction
Maize plants with native maize B-chromosomes (Bs) in their complements prevail with different frequencies in tested populations by balancing the impact of selfish drive (i.e. microgametophytic chromatid non-disjunction associated with preferential ovum fertilization) with that of counteracting factors (i.e. meiotic loss through lagging univalents with micronuclei formation). Driving as well as counteracting factors for B presence in maize plants were assigned to the Bs themselves and to the regular A-chromosomes (As) of the host genome with complex interactions among them (reviewed in: Jones et al. 2008, Cytogenet Genome Res 120, 265-280).
In order to study host species-specific influences on behavior and mode of inheritance of maize Bs in a very remotely alien genetic background, we transferred native Bs of maize (Zea mays L. ssp. mays cv. Black Mexican Sweet) into common oat (Avena sativa L. ssp. sativa cv. Starter) (Kynast et al. 2007, Maize Genet Coop Newsletter 81, 17-19) and proved their maternal and paternal transmission to successive offspring generations (Kynast et al. 2008, Maize Genet Coop Newsletter 82, 19-21).
Native maize Bs are among the first-discovered (Kuwada 1925, Bot Mag Tokyo 39, 227-234) and presumably molecularly and cytogenetically best-described Bs in the plant realm (Jones and Diez 2004, The B chromosome database, http://www.bchromosomes.org/bdb/). The extensive experimental data on behavior and mode of inheritance of maize Bs in their native host species can serve as excellent references when evaluated and compared with those data on behavior and mode of inheritance of maize Bs in an alien host species.
Native oat Bs have not been reported to exist in wild and cultivated species of hexaploid oats. These species apparently have not been exposed to native Bs during their evolution. Therefore, the oat genomes are not likely to have developed and/or to have been selected for genetic factors that control behavior and mode of inheritance of Bs.
Hybridization experiments involving different hexaploid oat lines (2n = 6x = 42) and the maize line B73B (2n = 2x + 6 Bs = 20 + 6 =26) produced two fertile inter-species F1-plants (5811_1 and 5845_1) carrying maize Bs in shoot and root tissues. PCR assays of their genomic DNAs using two maize B-specific markers and a selected set of maize A-specific SSR markers proved presence of maize Bs and absence of maize As in the leaf tissues of both F1-plants. GISH assays using fluorophore-labeled genomic maize DNA as probe on root meristems proved that the F1-plant 5811_1 retained three maize Bs along with the complete haploid set of 21 oat chromosomes (2ni – nj = 3x + 3 Bs = 21 + 3 = 24; Bs are named B.1), and that one maize B was retained along with the complete haploid set of 21 oat chromosomes (2ni – nj = 3x + 1 B = 21 + 1 = 22; B is named B.2) in the F1-plant 5845_1. Controlled self-pollination of the F1-plants 5811_1 and 5845_1 produced 59 and 73 seeds (F2 1188_1 � 1188_59, and F2 1190_1 � 1190_73), respectively. Cytological and molecular analyses of 36 F2-offspring of the F1-plant 5811_1 revealed 27 F2-plants with different numbers of Bs and nine F2-plants without a B (Figure 1), whereas in 36 F2-offspring of the F1-plant 5845_1 no F2-plant had a B, neither in its shoots nor in its roots based on PCR and GISH assays.
We addressed the question in our research objectives: How do maize Bs pair in microsporocytes during meiosis I after being transferred from maize into oats, i.e. after being converted from native Bs to alien Bs?
Materials and Methods
Oat inbred lines Starter-1, Sun II-1, oat cultivar Paul and maize inbred line B73B, were grown and crossed, hybrids in vitro cultivated and molecularly and cytologically tested, and consecutive offspring produced and analyzed as described elsewhere (Kynast et al. 2007, 2008). The oat inbred lines Starter-1 and Sun II-1 are single plant descendents from the oat cultivars Starter and Sun II, respectively; Starter, Sun II and Paul were from the oat stock collection at the University of Minnesota Saint Paul. The line B73B is a dent corn inbred B73 derivative that carries six Bs of the sweet corn cultivar Black Mexican Sweet (2n = 2x + 6 Bs = 20 + 6 = 26); seed of B73B was generously provided by JA Birchler, University of Missouri Columbia.
We selected oat genotypes with different numbers of added Bs in their complements among 36 tested and cultivated F2-offspring of the F1-plant 5811_1 based on estimated chromosome numbers and histological stability/instability of their root meristems by using the Feulgen-staining technique and GISH assay of ice water-pretreated and fixed root tips. The following four genotypes with stable karyotypes without any indication of mosaic meristems in their roots (F2-plants 1188_3, 1188_7, 1188_20 and 1188_8) were selected from the total of 27 maize B-positive F2-plants (Figure 1) in order to develop an oat-maize addition (OMA) series of alien maize B addition lines of hexaploid oats (OMAmB.1, OMAdB.1, OMAtB.1, and OMAqB.1 for monosomic, disomic, trisomic, and tetrasomic addition, respectively) for seed production (Table 1) and for the analyses of metaphase I pairing performance of the alien maize Bs (Table 2).
We germinated eight F3-seeds from each of the four offspring populations (F3 1374_10 � 1374_18, F3 1378_1 � 1378_8, F3 1391_1 � 1391_8, and F3 1379_1 � 1379_8) of these four different F2-plants and verified chromosome numbers and histological stability/instability of their root meristems as described for the 36 analyzed F2-plants. F3-seed production was by controlled self-fertilization of individual F2-panicles (a-, b-, and c-panicles) from the physiologically first three F2-tillers (a-, b-, and c-tillers, correspondingly) with flag leaves, of which their genomic DNAs tested B-positive in PCR assays using two maize B-specific markers. For each of the four lines, we selected one out of the eight F3-plants with appropriate stable karyotypes for meiosis analyses. Because the panicles of the F3-plants� a-tillers were reserved for controlled F4-seed production, we used the b- and c-panicles for meiosis assays (Table 2).
In order to increase the conclusive force of our data generated from F3-plants, we also observed B pairing performance in plants of the successive offspring generation with appropriate stable karyotypes. We analyzed meioses from b- and c-panicles of one out of six cultivated F4-plants for each line (F4 000769_1 � 000769_6, F4 000805_1 � 000805_6, F4 000837_1 � 000837_6, and F4 000853_1 � 000853_6) grown under environmental conditions equal to those used for F3-plant cultivation (Table 2).
Anthers of an appropriate physiological age to have the majority of microsporocytes at metaphase I (tested using aceto-carmine quick squash technique) were fixed in a mixture of 1.5 volume parts of methanol, 1.5 volume parts of ethanol and 1 volume part of glacial acetic acid at room temperature (RT) for two days. For slide preparation, fixed anthers were rinsed in 45%v/v acetic acid at RT for about 15 min. The two thecae of an anther were split and separately processed further. Theca ends were cut open and microsporocytes gently stroked out into a droplet of 45%v/v acetic acid onto a glass slide. Pressing a cover slip firmly upon the cell area, freezing the slide in liquid N2, and flicking off the cover slip accomplished squash preparation. Slides – dried in absolute ethanol at RT for about 30 min followed by air-drying at RT for about 1 h – were processed through a regular GISH procedure at a stringency of �85% using fluorophore-labeled genomic maize DNA as hybridization probe. Microsporocytes were observed and pairing scored by the use of an epifluorescence microscope equipped with a CCD camera for picture documentation.
Results and Conclusions
Table 3 summarizes the data of chromosome pairing performance for the different numbers of Bs observed in microsporocytes at metaphase I of the four different addition lines OMAmB.1 (monosomic B addition), OMAdB.1 (disomic B addition), OMAtB.1 (trisomic B addition), and OMAqB.1 (tetrasomic B addition). We screened 30 microsporocytes for each line from four panicles of the selected F3- and F4-plants of the addition line. In the monosomic B addition line OMAmB.1, 30 sporocytes had one B univalent, and no pairing between a B and any of the oat As. In the disomic B addition line OMAdB.1, 18 sporocytes had two B univalents, and 12 sporocytes had one B bivalent. Again, no sporocytes showed pairing between a B and any of the oat As. In the trisomic B addition line OMAtB.1, 19 sporocytes had three B univalents, and 11 sporocytes had one B univalent plus one B bivalent. None of the 30 sporocytes had a B trivalent, and none of the 30 sporocytes showed pairing between a B and any of the oat As. In the tetrasomic B addition line OMAqB.1, 12 sporocytes had four B univalents, and 13 sporocytes had two B univalents plus one B bivalent, and 5 sporocytes had two B bivalents. None of the 30 sporocytes had a B quadrivalent, and none of the 30 sporocytes had a B trivalent plus a B univalent configuration. Again, the line did not show pairing between a B and any of the oat As. Taken all data together (Table 4), there are four main results and conclusions from our experiments:
First, there were no configurations of pairing between maize Bs and oat As in any sporocytes, even when the maize B was a monosomic addition only, and thus, had not a homolog to pair with as it was the case, for instance, in F3-plant 1374_13 and F4-plant 000769_2 (monosomic B addition line OMAmB.1). There was no sporocyte with chiasmatic conjugation of any maize B with an oat A. Moreover, the maize B univalents did not show any spatial proximity indicative of secondary end-to-end, end-to-side or side-by-side alignments of achiasmatic association with oat As. In contrast, maize Bs in any configuration appeared physically well separated from oat As even while being perfectly co-orientated with the complement of oat A bivalents across the equatorial plate (Figure 2).
Second, univalents of maize Bs frequently scattered across the spindle figure off the equator (Figure 2a). Nonetheless, every so often B univalents were remarkably well integrated into the heterotypic cell equator (Figure 2b). Although at an overall higher frequency (20/30 non-equatorial positions versus 10/30 equatorial positions), the variable positions were of no recognizable pattern for the distance to equator or pole, and therefore, more likely resulting from the impact of the methodology of squashing the 3D structure of the sporocyte to a flat plate by the slide preparation technique. True 3D analysis of the sporocytes by using, for instance, confocal microscopy will deliver data that are more reflective of the genuine position pattern of univalent Bs. Further research experiments are in progress to investigate the spatial organization of alien maize B univalents and bivalents in oat sporocytes. Yet, our observations point to an amazing stability of B univalents in the alien oat background probably contributing to high frequencies of maternal as well as paternal transmission to offspring (Kynast et al. 2008). The overall harmonic performance is leaving us with the impression that the alien maize Bs behave quite normally in the oat genome with a good fit into the oat timing for chromosome formation, pairing and orientation during prophase I and metaphase I.
Third, when a B had a homologous partner for potential
pairing, bivalents were formed, notwithstanding univalent formation at a modest
frequency, e.g. in
the disomic B
addition line OMAdB.1
(F3-plant 1378_4 and F4-plant 000805_2). The significant
number of sporocytes showing two B
univalents instead of one B
bivalent (![]() per sporocyte: 1.2I
versus 0.4II)
distinguishes pairing performance of alien maize Bs from that of native maize Bs (i.e. maize Bs in maize) and of native Bs in other plant species (e.g. rye) too (Figures 2c and 2d). Also, the
alien maize B pairing
differs from that of alien regular As. In general, homologous As in disomic condition hosted by an alien
genome almost always pair and, hence, form bivalents instead of two univalents
setting aside major structural rearrangements between homologs by chromosome
mutations and plant mutants with alleles for asynaptic behavior of individual
chromosomes and whole genomes. However, we cannot exclude in our conclusions
drawn from metaphase I pairing data alone that the enlarged number of
sporocytes with B
univalents could result from (during zygotene) perfectly synapsed, but (during
diplotene) prematurely desynapsed chromosome pairs due to (during pachytene)
achiasmatic conjugation caused by, for instance, failure or extreme reduction
of crossing over. Further molecular cytogenetic analyses of Bs in sporocytes at zygotene, pachytene,
and diplotene are in progress and will address the question on whether the
increased B univalent
frequency in disomic B
additions does result from asynapsis and/or premature desynapsis due to
achiasmatic chromosome conjugation.
per sporocyte: 1.2I
versus 0.4II)
distinguishes pairing performance of alien maize Bs from that of native maize Bs (i.e. maize Bs in maize) and of native Bs in other plant species (e.g. rye) too (Figures 2c and 2d). Also, the
alien maize B pairing
differs from that of alien regular As. In general, homologous As in disomic condition hosted by an alien
genome almost always pair and, hence, form bivalents instead of two univalents
setting aside major structural rearrangements between homologs by chromosome
mutations and plant mutants with alleles for asynaptic behavior of individual
chromosomes and whole genomes. However, we cannot exclude in our conclusions
drawn from metaphase I pairing data alone that the enlarged number of
sporocytes with B
univalents could result from (during zygotene) perfectly synapsed, but (during
diplotene) prematurely desynapsed chromosome pairs due to (during pachytene)
achiasmatic conjugation caused by, for instance, failure or extreme reduction
of crossing over. Further molecular cytogenetic analyses of Bs in sporocytes at zygotene, pachytene,
and diplotene are in progress and will address the question on whether the
increased B univalent
frequency in disomic B
additions does result from asynapsis and/or premature desynapsis due to
achiasmatic chromosome conjugation.
Fourth, in all observed sporocytes, the trisomic
addition of homologous maize Bs
in the line OMAtB.1
(F3-plant 1391_8 and F4-plant 000837_4) did not result in
the formation of B
trivalents (Figures 2e and 2f). Likewise, the sporocytes with tetrasomic
addition of homologous maize Bs
in the line OMAqB.1
(F3-plant 1379_4 and F4-plant 000853_3) did not form one B quadrivalent or one B trivalent plus one B univalent either (Figures 2g and 2h).
All maize Bs appeared
just to form univalents and bivalents only in oat background with a modest
preference for univalents (![]() per sporocyte: 2.3I
versus 0.4II
in OMAtB.1 and 2.5I
versus 0.8II
in OMAqB.1,
respectively) though more than two
homologous pairing partners were present in the sporocytes of both genotypes.
This obvious restraint on trivalents and quadrivalents seemed intriguing
particularly owing to all Bs
in the plant materials tested were descended from the same origin of maize germ
plasm Black Mexican Sweet
and go back to one defined (Starter-one oat � B73B maize) hybridization event (F1-plant
5811_1). Hence, all the maize Bs
represent from a cytogenetic view multiple copies of the same chromosome. It
seems feasible to exclude significant structural differences among the
individual Bs as a
cause for the multivalent suppression. In addition, B bivalent formation is not suppressed
though modestly reduced. The restraint on multivalent formation causes an
additional intriguing feature to the B behavior in metaphase I sporocytes. When the disomic,
trisomic and tetrasomic addition lines are compared, the frequency
distributions of sporocytes with B
univalents are more polynomial than normal (Figure 3). The average bivalent
frequencies (
per sporocyte: 2.3I
versus 0.4II
in OMAtB.1 and 2.5I
versus 0.8II
in OMAqB.1,
respectively) though more than two
homologous pairing partners were present in the sporocytes of both genotypes.
This obvious restraint on trivalents and quadrivalents seemed intriguing
particularly owing to all Bs
in the plant materials tested were descended from the same origin of maize germ
plasm Black Mexican Sweet
and go back to one defined (Starter-one oat � B73B maize) hybridization event (F1-plant
5811_1). Hence, all the maize Bs
represent from a cytogenetic view multiple copies of the same chromosome. It
seems feasible to exclude significant structural differences among the
individual Bs as a
cause for the multivalent suppression. In addition, B bivalent formation is not suppressed
though modestly reduced. The restraint on multivalent formation causes an
additional intriguing feature to the B behavior in metaphase I sporocytes. When the disomic,
trisomic and tetrasomic addition lines are compared, the frequency
distributions of sporocytes with B
univalents are more polynomial than normal (Figure 3). The average bivalent
frequencies (![]() per sporocyte: 0.4II in OMAdB.1, 0.4II OMAtB.1, and 0.8II in OMAqB.1) appear remarkably constant (Table 4).
per sporocyte: 0.4II in OMAdB.1, 0.4II OMAtB.1, and 0.8II in OMAqB.1) appear remarkably constant (Table 4).
In order to track down potential genetic factors for the multivalent suppression that interact between the maize Bs and the host species we are trying to transfer the Bs from Starter-one oat into further different genetic backgrounds. We have recently started a backcross program of the two lines OMAtB.1 and OMAqB.1 to the hexaploid oats A. fatua L., A. sterilis L., and A. sativa L. subspp. byzantina and nuda.
Table 1: Selected F1-plant and a-panicles of F2-plants for addition line development; OMA = oat-maize chromosome addition, m = monosomic, d = disomic, t = trisomic, q = tetrasomic, B.1 = B that is descended from the first recovery in one individual (oat � maize) plant 5811_1
Table 2: Selected b- and c-panicles of F3- and F4-plants for meiosis assays
Table 3: Maize B pairing performance in metaphase I microsporocytes (n = 30 per plant line) of four oat-maize B addition lines, I = B univalents, II = B bivalents, III = B trivalents, IV = B quadrivalents
Table 4: Minimal, maximal and mean frequencies, ranges, standard deviations and coefficients of variation of maize B pairing configurations in metaphase I microsporocytes (n = 30 per plant line) of four oat-maize B addition (OMA) lines; m = monosomic, d = disomic, t = trisomic, q = tetrasomic, B.1 = B of first recovery, I = B univalents, II = B bivalents, III = B trivalents, IV = B quadrivalents
Figure 1: Numbers of 36 tested F2-offspring without and with maize B additions reflecting the transmission frequencies of added maize Bs from F1 to F2 through doubled haploid formation by unreduced gametes of the aneuhaploid F1-plant 5811_1 (2ni – nj = 3x + 3 Bs = 21 + 3 = 24) after self-fertilization; presentation includes data from Kynast et al. 2007 (20 tested F2-offspring) and Kynast et al. 2008 (10 tested F2-offspring)
Figure 2: Metaphase I microsporocytes of OMAxB.1 plants with different numbers (x) of added maize Bs labeled by GISH (green fluorescing, univalent marked with one arrow head, bivalent marked with one double arrow head, pairs of thin arrows indicate direction of chromosome migration towards the poles); (2a) OMAmB.1, one B univalent scattered across the spindle figure outside the cell equator; (2b) OMAmB.1, one B univalent well integrated into the cell equator; (2c) OMAdB.1, two B univalents scattered across the spindle figure outside the cell equator; (2d) OMAdB.1, one B bivalent well integrated into the cell equator; (2e) OMAtB.1, three B univalents scattered across the spindle figure outside the cell equator; (2f) OMAtB.1, one B univalent plus one B bivalent both well integrated into the cell equator; (2g) OMAqB.1, four B univalents scattered across the spindle figure outside the cell equator; (2h) OMAqB.1, two B univalents scattered across the spindle figure outside the cell equator plus one B bivalent well integrated into the cell equator; (2i) OMAqB.1, two B bivalents well integrated into the cell equator
Figure 3: Polynomial frequency distributions of metaphase I sporocytes with B univalents in the addition lines OMAdB.1, OMAtB.1, and OMAqB.1
Table 1: Selected F1-plant and a-panicles of F2-plants for addition line development; OMA = oat-maize chromosome addition, m = monosomic, d = disomic, t = trisomic, q = tetrasomic, B.1 = B that is descended from the first recovery in one individual (oat � maize) plant 5811_1
|
Line |
Genotype/Karyotype |
|
|
F1 5811_1 (aneuhaploid hybrid) with three Bs (2ni – nj = 3x + 3 Bs = 21 + 3 = 24) |
|
OMAmB.1 |
F2 1188_3a (aka 5811_1_3a) with one B (2n = 6x + 1 B = 42 + 1 = 43) |
|
OMAdB.1 |
F2 1188_7a (aka 5811_1_7a) with two Bs (2n = 6x + 2 Bs = 42 + 2 = 44) |
|
OMAtB.1 |
F2 1188_20a (aka 5811_1_20a) with three Bs (2n = 6x + 3 Bs = 42 + 3 = 45) |
|
OMAqB.1 |
F2 1188_8a (aka 5811_1_8a) with four Bs (2n = 6x + 4 Bs = 42 + 4 = 46) |
Table 2: Selected b- and c-panicles of F3- and F4-plants for meiosis assays
|
Line |
Genotype/Karyotype |
|
OMAmB.1 |
F3 1374_13b (aka 5811_1_3a_13b) with one B (2n = 6x + 1 B = 42 + 1 = 43) |
|
F3 1374_13c (aka 5811_1_3a_13c) with one B (2n = 6x + 1 B = 42 + 1 = 43) |
|
|
F4 000769_2b (aka 5811_1_3a_13a_2b) with one B (2n = 6x + 1 B = 42 + 1 = 43) |
|
|
F4 000769_2c (aka 5811_1_3a_13a_2c) with one B (2n = 6x + 1 B = 42 + 1 = 43) |
|
|
OMAdB.1 |
F3 1378_4b (aka 5811_1_7a_4b) with two Bs (2n = 6x + 2 Bs = 42 + 2 = 44) |
|
F3 1378_4c (aka 5811_1_7a_4c) with two Bs (2n = 6x + 2 Bs = 42 + 2 = 44) |
|
|
F4 000805_2b (aka 5811_1_7a_4a_2b) with two Bs (2n = 6x + 2 Bs = 42 + 2 = 44) |
|
|
F4 000805_2c (aka 5811_1_7a_4a_2c) with two Bs (2n = 6x + 2 Bs = 42 + 2 = 44) |
|
|
OMAtB.1 |
F3 1391_8b (aka 5811_1_20a_8b) with three Bs (2n = 6x + 3 Bs = 42 + 3 = 45) |
|
F3 1391_8c (aka 5811_1_20a_8c) with three Bs (2n = 6x + 3 Bs = 42 + 3 = 45) |
|
|
F4 000837_4b (aka 5811_1_20a_8a_4b) with three Bs (2n = 6x + 3 Bs = 42 + 3 = 45) |
|
|
F4 000837_4c (aka 5811_1_20a_8a_4c) with three Bs (2n = 6x + 3 Bs = 42 + 3 = 45) |
|
|
OMAqB.1 |
F3 1379_4b (aka 5811_1_8a_4b) with four Bs (2n = 6x + 4 Bs = 42 + 4 = 46) |
|
F3 1379_4c (aka 5811_1_8a_4c) with four Bs (2n = 6x + 4 Bs = 42 + 4 = 46) |
|
|
F4 000853_3b (aka 5811_1_8a_4a_3b) with four Bs (2n = 6x + 4 Bs = 42 + 4 = 46) |
|
|
F4 000853_3c (aka 5811_1_8a_4a_3c) with four Bs (2n = 6x + 4 Bs = 42 + 4 = 46) |
Table 3: Maize B pairing performance in metaphase I microsporocytes (n = 30 per plant line) of four oat-maize B addition lines, I = B univalents, II = B bivalents, III = B trivalents, IV = B quadrivalents
|
Line |
Cell number per line |
M I Configuration |
Cell number per Configuration |
|
OMAmB.1 |
30 |
1I |
30 |
|
OMAdB.1 |
30 |
2I |
18 |
|
1II |
12 |
||
|
OMAtB.1 |
30 |
3I |
19 |
|
1I + 1II |
11 |
||
|
1III |
0 |
||
|
OMAqB.1 |
30 |
4I |
12 |
|
2I + 1II |
13 |
||
|
2II |
5 |
||
|
1I + 1III |
0 |
||
|
1IV |
0 |
Table 4: Minimal, maximal and mean frequencies, ranges, standard deviations and coefficients of variation of maize B pairing configurations in metaphase I microsporocytes (n = 30 per plant line) of four oat-maize B addition (OMA) lines; m = monosomic, d = disomic, t = trisomic, q = tetrasomic, B.1 = B of first recovery, I = B univalents, II = B bivalents, III = B trivalents, IV = B quadrivalents
|
Genotypes |
OMAmB.1 |
OMAdB.1 |
OMAtB.1 |
OMAqB.1 |
||||||||||||
|
Pairing figures |
I |
II |
III |
IV |
I |
II |
III |
IV |
I |
II |
III |
IV |
I |
II |
III |
IV |
|
|
30 |
n/a |
n/a |
n/a |
36 |
12 |
n/a |
n/a |
68 |
11 |
0 |
n/a |
74 |
23 |
0 |
0 |
|
xmin per cell |
1 |
n/a |
n/a |
n/a |
0 |
0 |
n/a |
n/a |
1 |
0 |
0 |
n/a |
0 |
0 |
0 |
0 |
|
xmax per cell |
1 |
n/a |
n/a |
n/a |
2 |
1 |
n/a |
n/a |
3 |
1 |
0 |
n/a |
4 |
2 |
0 |
0 |
|
|
1 |
n/a |
n/a |
n/a |
1.2 |
0.4 |
n/a |
n/a |
2.3 |
0.4 |
0 |
n/a |
2.5 |
0.8 |
0 |
0 |
|
|
0 |
n/a |
n/a |
n/a |
2 |
1 |
n/a |
n/a |
2 |
1 |
0 |
n/a |
4 |
2 |
0 |
0 |
|
|
0 |
n/a |
n/a |
n/a |
1.0 |
0.5 |
n/a |
n/a |
1.0 |
0.5 |
0 |
n/a |
1.5 |
0.7 |
0 |
0 |
|
|
0 |
n/a |
n/a |
n/a |
83 |
125 |
n/a |
n/a |
43 |
125 |
n/d |
n/a |
60 |
88 |
n/d |
n/d |
Figure 1: Numbers of 36 tested F2-offspring without and with maize B additions reflecting the transmission frequencies of added maize Bs from F1 to F2 through doubled haploid formation by unreduced gametes of the aneuhaploid F1-plant 5811_1 (2ni – nj = 3x + 3 Bs = 21 + 3 = 24) after self-fertilization; presentation includes data from Kynast et al. 2007 (20 tested F2-offspring) and Kynast et al. 2008 (10 tested F2-offspring)
Figure 2
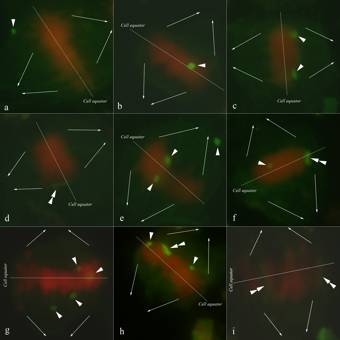
Figure 3: Polynomial frequency distributions of metaphase I sporocytes with B univalents in the addition lines OMAdB.1, OMAtB.1, and OMAqB.1