Maize Genetics Cooperation Newsletter vol 81 2007
Identifying low-copy loci by FISH on chromosomes in 3-D: Position of p1, the 22kDa alpha zein cluster, and the 5S rDNA locus
--Harper, LC; Wang, R; Cande, WZ
As part of an effort to cytologically map single copy genes to maize pachytene chromosomes, we developed a fluorescent in situ hybridization (FISH) method for identifying low-copy loci on chromosomes in 3-D. The advantage of this 3-D method is that nuclear architecture is preserved, and important structural information, such as the relative position of chromosomes, is maintained. We have routinely used this FISH protocol to analyze the degree of homologous pairing in various maize meiotic mutants; for example, pam1 (Golubovskaya et all., Genetics 162:1979-1993, 2002), phs1 (Pawlowski et al., Science 303:89-92, 2004), sgo1 (Hamant et al., Curr. Biol. 15:948-954, 2005), afd1 (Golubovskaya et al., J. Cell Sci. 119:3306-3315, 2006), and others (Pawlowski et al., Plant Cell 15:1807-1816, 2003). In this article, we report a detailed protocol for this 3-D FISH method. This method, however, is not suitable for routine cytological mapping of single copy genes. To do that, we developed a 2-D FISH protocol which is suitable for cytological mapping, but does not preserve nuclear architecture (Wang et al., Plant Cell 18:529-544, 2006).
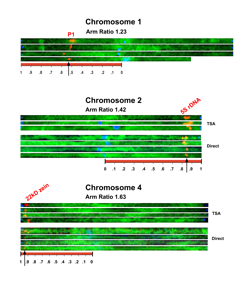
Here we report the cytological position of three loci on maize pachytene chromosomes; p1 on chromosomes 1, the 22kDa alpha zein cluster (z1C/SF4/az22z1 cluster http://www.maizegdb.org/cgi-bin/displaylocusrecord.cgi?id=9017693) on chromosome 4, and the 5S rDNA loci on chromosome 2L. These loci are genetically mapped, allowing us to use them as anchor points for a cytogenetic map. Some of this data has been used to confirm the RN map generated by Laurie Anderson (Anderson et al., Genetics 166:1923-1933, 2004). As a further check, we used the Morgan2McClintock translator (Lawrence et al., Genetics 172:2007-2009, 2006) to compare our empirically determined positions to those calculated based on the RN maps. We report a detailed protocol of the method, and incorporate the modifications we currently use.
The 5S rDNA locus is located at 2L.85. We routinely detect the 5S rDNA locus with probes directly labeled with fluorescent nucleotides, so we used this probe as a test to see if TSA amplification would work. We compared DIG labeled 5S rDNA probes detected with anti-DIG FITC, or with the TSA amplification method. TSA amplification increased the average signal pixel intensity up to 15-fold above background, which is roughly 2-3 times better detection than with anti-DIG-FITC (data not shown), or with a directly labeled probe (Figure).
To determine the cytological position of the 5S rDNA locus, we traced and computationally straightened chromosome two from seven nuclei (Figure, chromosome 2). The figure is presented in color at (http://mnl.maizegdb.org/mnl/81/06harper.htm; in the near future also at www.maizegdb.org/mnl/81/06harper.htm), where everything can be seen better. In the top three chromosomes in this panel, DIG-labeled probe was detected with TSA, while in the bottom 4 we used probes directly labeled with fluorescent nucleotides. The 5S rDNA locus is at an average position of 2L.85 (Table). The most difficult part of this procedure is the successful tracking of the complete length of a chromosome before entering it into the straightening program. Our position of the 5S rDNA locus is in good agreement with that found previously using a radioactively labeled probe (Wimber et al., Chromosoma 47:353-360, 1974).
To check if our cytological position was in good agreement with the Recombination Nodule map (RN map, see Anderson et al., 2004), we used the Morgan2McClintock translator (Lawrence et al., 2006) (http://golem4.zool.iastate.edu/Morgan2McClintock/), and put in the Genetic 2005 2 map (http://www.maizegdb.org/cgi-bin/displaymaprecord.cgi?id=940881) for translation. The translator puts the 5S rDNA locus at 2L.88, in good agreement with our position of 2L.85.
|
5S |
2L arm
length |
Distance: cen-5S |
position |
|
|
2576 |
2224 |
0.863354037 |
|
|
2208 |
1920 |
0.869565217 |
|
|
2464 |
2072 |
0.840909091 |
|
|
2408 |
2000 |
0.830564784 |
|
|
2584 |
2240 |
0.866873065 |
|
|
2528 |
2128 |
0.841772152 |
|
|
|
ave |
0.852173058 |
|
|
|
SD |
0.016404664 |
Lengths
are reported in pixels
Detection of the 22kDa alpha zein cluster with TSA, at 4S.95. In order to determine if this signal amplification method was sufficient to allow the detection of a much lower copy gene, we used a zein coding sequence from the 22kDa alpha zein cluster, located on 4S, as a probe. This locus contains about 22 copies of the small alpha zein gene, in tandem array (Llaca and Messing, Plant J. 15:211-220, 1998), and we reasoned that this should allow more probe to hybridize to the target sequence. With a DIG-labeled probe, we were not able to detect this locus with anti DIG-FITC, but we were able to detect this locus routinely using the TSA amplification (top 4 chromosomes in the chromosome 4 panel). We can also detect the 22kDa alpha zein cluster, albeit less robustly, by using a zein probe directly labeled with fluorescent nucleotides (bottom 4 chromosomes in the chromosome 4 panel). In both cases, one bright spot was found on a single chromosome very near the telomere. Following chromosome tracing and straightening, we determined its position as 4S.95 (Figure and Table). In order to determine whether the correct chromosome was hit, we used a centromere probe that is specific to centromere 4, and in all cases, the zein probe hybridized to the same chromosome as the centromere 4 probe (data not shown).
Our results consistently put the 22kDa alpha zein cluster at 4S.95 (in the A344 and KYS inbred)--very close to the telomere. The first mapping of the zein cluster was done in the BSSS53 inbred, and zein genes were found 0.4 and 2.2 cM from the drz1 locus (Chaudhuri and Messing, Mol. Gen. Genet. 246:707-715, 1995). The genes in the 22kDa alpha zein cluster are not on the Genetic 2005 map, but the drz1 locus is. We used the Morgan2McClintock translator to determine if our position is similar to that found on the RN map. Translating the Genetic 2005 4 map on Morgan2McClintock, puts drz1 at 4S.93. This is consistent with our cytological position. However, in other mapping data using the Pioneer composite map, az22z1, a single gene in the 22kDa alpha zein cluster, was found completely linked with csu235 (http://www.maizegdb.org/cgi-bin/displayrecombrecord.cgi?id= 9017699). On the translated Genetic 2005 RN map, csu235 is at 4S.83. Translating the Pioneer composite 1999 map places csu235 at 4S.78; even further from our empirically determined cytological position. Possibly, using mapping data from one inbred (BSSS53), a cytological position from another (A344), and an RN map from yet a third inbred (KYS) may not yield a usable mark to anchor the genetic and cytological map. Alternatively, if the mapping in the BSSS53 inbred is the most accurate genetic mapping, there may be no real discrepancy.
|
zein |
4S arm
length |
Distance: cen-zein |
position |
|
|
2016 |
1928 |
0.956349206 |
|
|
1784 |
1696 |
0.950672646 |
|
|
1776 |
1664 |
0.936936937 |
|
|
1936 |
1816 |
0.938016529 |
|
|
|
ave |
0.945493829 |
|
|
|
SD |
0.009553181 |
Lengths
are reported in pixels
The p1 locus is 1L.53. The p-wr allele of p1 contains an array of 6 tandem copies of the p1 gene (Zhang and Peterson, Plant Cell 17:903-914, 2005). Using this allele as a target, we hybridized p1 probes to pachytene chromosomes and used TSA amplification for detection. We were able to routinely detect the p1 gene. We selected 4 cells (two from W22 and two from W23), and completely straightened chromosome 1 from these cells (Figure, chromosome 1 panel). The cytological position of the p1 locus is the same in both inbreds (Table): 1l.53. The p1 gene has been previously mapped relative to many translocations, and p1 was found to be distal to T1-5(6899) (1S.32) (Auger and Sheridan, MNL67:46, 1993) and to T1-2b (1S.43) (Anderson, Genetics 26:452--459, 1941), yet proximal to T1-4b (1S.55)(Auger and Sheridan, 1993). This places p1 between 1S.43 and 1S.55, and in good agreement with out direct findings.
To determine the position of p1 on the RN maps, we translated the Genetic 2005 1 map (http://www.maizegdb.org/cgi-bin/displaymaprecord.cgi?id=940880) and found p1 at 1L.63. This discrepancy, 10% of the arm length, seems high to us but we have no explanation for this discrepancy.
|
p1 |
1S arm
length |
Distance:
cent - p1 |
position |
|
|
2696 |
1392 |
0.516320475 |
|
|
2544 |
1274 |
0.500786164 |
|
|
2464 |
1360 |
0.551948052 |
|
|
2736 |
1488 |
0.543859649 |
|
|
|
ave |
0.528228585 |
|
|
|
SD |
0.023817591 |
Lengths
are reported in pixels.
We developed a 3-D FISH strategy to detect multi- and low-copy genes on maize prophase chromosomes in intact nuclei where chromosome organization is preserved. Acquiring data in 3-D allows us to correlate biological events, such as the position of genes and defined heterochromatic blocks (i.e., centromeres, telomeres and knobs) during homologous pairing, recombination and synapsis. We use 3-D FISH (without TSA amplification) and the 5S rDNA probe routinely to assess the degree of homologous pairing in meiotic mutants. We have tried 3-D FISH with and without TSA amplification to detect a number of single copy genes, included kn1, su1, ahd1, bz1 and other. However, we have not been able to reliably detect single copy genes. Thus, this 3-D FISH method is not sensitive enough to use for routine cytogenetic mapping. For that purpose, we recommend using HRgeneFISH (Anderson et al., 2004).
Maize lines and DNAs used. Inbred line A344 was obtained from Inna Golubovskaya (UC Berkeley) and was used for 5S rDNA and zein gene experiments, KYS was obtained from the National Plant Germplasm System (now GRIN) and was used for 5S rDNA and zein gene experiments, p-wr lines in W23 and W22 were obtained from Tom Peterson (University of Iowa) and these were used for the p1 experiments.
The 22 kDa alpha zein gene was generously provided by Victor Llaca and Jo Messing (Rutgers, NJ). The p1 gene was generously provided by Tom Peterson (Iowa State Univ., Ames), and the 5S rDNA gene was generously provided by Elizabeth Zimmer (Smithsonian Inst.).
Probe labeling. The three probes used in this study where labeled with alkali- stable digoxigenin -11-dUTP (Roche) (DIG) by PCR. Approximately 1 to 10 nanograms of template DNA was added to a standard PCR reaction mix: 2 �l 10x buffer with 15 mM MgCl2 from Perkin Elmer, 2 �l forward primer 10 pmol/�l, 2 �l reverse primer 10 pmol/�l, 2 �l 1mM dATP, dGTP, dCTP, a mixture of dTTP and dUTP-dig, 2 Units Amplitaq (Perkin-Elmer) and water to 20 �l. Labeling reactions were made in these proportions in various amounts from 20 to 100 �l. A PTC-100 PCR machine (MJ Research, Inc.) was used. For each labeling reaction, a 20 �l unlabeled control reaction was performed, and an aliquot of equal molar volume was run side by side with the labeling reaction in a gel of appropriate concentration for the fragment sizes expected. Incorporation of DIG could be seen visually from the gel shift, and the amount of DIG incorporation was occasionally calculated based on the degree of the gel shift. In addition, gels were blotted and developed as a western with anti-DIG-AP followed by NBT/BCIP detection (Roche protocol). This allowed us to estimate the degree of DIG incorporation in each probe.
Incorporation of DIG-11-dUTP by Taq polymerase was very sensitive to fragment length. We could label fragments of up to 200 bp with a ratio of 1:1 of dTTP and DIG-11-dUTP (�highly-labeled�). Fragments of 500-700 bp were labeled with a 2:1 ratio, and 2 kb fragments could be labeled with a ratio of 9:1 dTTP and DIG-11-dUTP (�low-labeled�). Intermediate sizes required intermediate ratios. We found that a mixture of highly-labeled and low-labeled probe often gave the best results for the zein probe. We also found PCR labeling can give better FISH results than random priming, terminal transferase and nick-translation labeling. We routinely use both PCR labeling and random priming to label probes for use in 3-D FISH.
Fixation
and embedding of meiocytes. Maize
anthers were removed from living immature tassels and fixed for 30 minutes with
4% formaldehyde (EM grade) in a special buffer designed to preserve chromatin
structure, �buffer A� (15 mM Pipes-NaOH, pH 6.8, 80 mM KCl,
20 mM NaCl, 0.5 mM EGTA, 2 mM EDTA, 0.15 mM
spermine tetra HCl, 0.05 mM spermidine, 1 mM DTT, 0.32 M
sorbitol) (Belmont et al., J. Cell Biol. 105:77-92, 1987; see also Dawe et al.,
Cell 76:901-912, 1994; Bass et al., J. Cell Biol. 137:5-18, 1997). After
fixation, anthers were rinsed in 1X buffer A three times for 30 minutes
each. Anthers are stored after
fixation and rinsing in the fridge in the dark. For the experiments reported here, anthers were used within
3 weeks after fixation. We have
subsequently found that anthers can be used up to two years after fixation with
no signs of degradation if they are stored in completely dark, airtight
containers at 4 degrees. For FISH,
meiocytes were extruded from anthers into 1X buffer A. 10�l of meiocytes in
buffer A were transferred by a BSA-coated pipette tip onto a glass cover
slip. 100�l of polyacylamide mix
(50�l 30:.8% bis-acrylamide, sterilized, filtered stock, kept at 4C and 50�l 2X buffer A) was catalyzed with 5�l of
ammonium persulfate (20%) and 5�l of Na2SO3 (20%) and
then vortexed; 5�l of this was added to the 10�l of meiocytes on the cover slip
and then mixed with the pipette tip very quickly. Another cover slip was immediately
placed on top and sometimes a small weight was added to slightly flatten the
meiocyte and the contents. The
polyacrylamide was allowed to polymerize for 30 minutes. The cover slips were then separated and
the resulting pad of meiocytes embedded in polyacryamide was placed in a well
containing a prehybridization solution of 50% deionized formamide in 2X SSC (in
a standard 6 well plate). This
solution was changed three times over the course of 1 hour, and then the
hybridization was started.
Fluorescence
in situ hybridization (FISH).
50 �l of a probe solution containing
labeled DNA (usually 1 �l, but amount determined
empirically for each new batch of probe) in 50% formamide and 2X SSC was used
for each pad. Probe solution was
added to each pad, then the pad was covered with a cover slip and sealed with
rubber cement. Probe was allowed
to penetrate for 30 to 60 minutes at 36C.
Strand separation was induced by placing the slide on a PCR block for 6
minutes at 95C. Pads were then incubated
at 30C overnight to allow hybridization. After hybridization, the pads went through a series of 10 to
20 minute washes to remove weakly hybridized probe and excess fluorescent
molecules: 2X SSC; 1X SSC, 1X PBS; 1X PBS + 0.1% tween-20; 1X PBS*. To detect single and low copy probes,
we developed a tyramide signal amplification method as follows: Pads FISHed DIG-labeled probes were
treated with a blocking solution (1% bovine serum albumin, 1X Roche block, in
1XPBS) for 1 hour. Then this block
was removed and 150mUnits was added per pad of anti-DIG-POD Fab fragments from
Roche (1�l of anti-DIG-POD-poly at 50mUnits
per pad and 1�l of anti-DIG-POD as supplied)
and left overnight in a humid chamber.
Then, excess antibody was removed with at least 5 hours of washing with
1X PBS, changing to fresh solution at least every hour. 100 �l
of tyramide-Cy3 solution containing 2 �l
tyramide-Cy3 in 98 �l �amplification
diluent�(from a tyramide signal amplification kit from NEN) was added to each
pad, and allowed to catalyze for 10 minutes. We optimized this time with various probes, testing times
from 3 minutes to 2 hours. We found
that the longer times simply increased background, and that 10 minutes was
optimal for the several probes we used.
Following the TSA step, pads were washed with 1X TBS plus 0.05% Tween20,
three times immediately, then 4 times, 15 minutes each. Then pads were washed in 1X TBS with no
Tween20, two times 10 minutes each.
TBS was used instead of PBS so that the DAPI would not precipitate in
the next step. DNA was then
stained with DAPI (5�g/�l in 1X TBS) for 30
minutes and washed out with 1X TBS three times, 10 minutes each. Pads were mounted in DABCO, by adding
and removing the DABCO three times to allow penetration into the pad. Then a 22x22 cover slip was placed on
top and sealed with nail polish.
(To use directly labeled probes, after this step, we wash in 1X TBS,
then complete the DAPI staining step.
We do not use the TSA amplification step for analysis of homologous
pairing.)
Meiocyte Imaging and Deconvolution. Cells were viewed with an Applied Precision Delta Vision Microscope system, consisting of an Olympus 1X70 inverted fluorescence/bright-field microscope and Olympus 100x 1.35 UPlanApo oil-immersion lens. Images were recorded by a Sensys Ch250 CCD camera, controlled by computer. 0.2-0.4�m sections in the z plane were collected; image size was 34�m x 34�m. A single maize meiocyte nucleus is usually 15 to 25 microns in thickness in our preparations (the small weight added during pad polymerization can flatten the nuclei to 15 microns). Three-dimensional data stacks representing individual nuclei were reiteratedly deconvolved using Deltavision 2.1 software (from Applied Precision). Deconvolved three-dimensional images were analyzed with Softworx 2.50 (from Applied Precision) software. The program '3D Model' was used to trace the chromosomes by hand in three dimensions through the x, y and z plane. The program 'Straighten' was used to straighten and then flatten the straightened chromosomes into two dimensions.
Please Note: Notes submitted to the Maize Genetics Cooperation
Newsletter may be cited only with consent of authors.