AMMI Model
Yge = m + ag + be + Â ln g gn rgn + ege
Yge = yield for the g genotype in e enviroment
m = general mean
ag = genotype effect
be = environment effect.
ln = n-th axis singular value (eigenvalue)
tgn and ren = corresponding genotype and environment scores (eigenvectors)
ege = normally distributed error.
Statistical model for the preliminary ANOVA procedure:
Yijk = m + ai + bj + (a x b )ij + rk(j) + eijk
Table 1: analysis of variance results
for yield
| Source | DF | SS | MS |
| Environments | 5 | 24650 | 4930** |
| Rep (Env) | 12 | 23640 | 1970 |
| Hybrids | 13 | 20540 | 1580** |
| Hyb x Env | 65 | 30550 | 470** |
| Error | 156 | 40560 | 260 |
(*, **) Significant at the 0.05 and 0.01 probability, respectively.
Table 2: analysis of variance results
for popping expansion
| Source | DF | SS | MS |
| Environments | 5 | 180.45 | 36.09** |
| Rep (Env) | 12 | 100.32 | 8.36 |
| Hybrids | 13 | 307.84 | 23.68 ** |
| Hyb x Env | 65 | 716.30 | 11.02** |
| Error | 156 | 765.05 | 5.08 |
(*, **) Significant at the 0.05 and 0.01 probability, respectively.
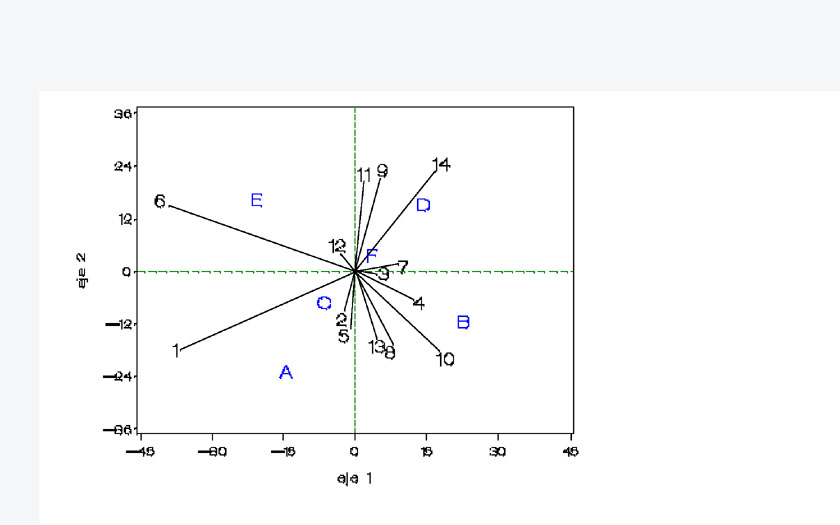
The interaction that can be described by two multiplicative components can be represented in a biplot (see biplots I and II). Cultivars are represented by lines, trials by points, both end points are the representation of the end points of vectors starting at the origin. The length of a cultivar line reflects the amount of interaction for that cultivar, thus according with Figure1, most interaction is due to genotypes 1, 6, 10 and 14. The angle between cultivar lines corresponds to the interaction betwen the interaction residuals. Genotypes 3 and 12, the nearest distributed to the center of the biplot, have more stability. Genotypes 1 and 9, 13 and 8, 2 and 5 are very similar with a high positive correlation. 1 and 10 have a negative correlation. 14 and 6 are very dissimilar with a correlation close to zero. Genotype 14 with a high residual interaction with D environment. The same occurs with 6 in E environment and genotype 1 in A.
In Figure 2, expansion volume, there is less stability for 3, 5 and 6 and the most for genotypes 10 and 14. Similar performance is shown by 7-8, 1-13 and 14. In contrast 5 and 6 are quite alike. There is a particular performance of the genotypes, analysing both figures jointly, that confirms the negative correlation between yield and expansion volume.
Figure 1. Biplot of the AMMI model for grain yield, with 14 genotypes (1,....14) and 6 environments (A,....F). PCA1 and PCA2 are represented by eje1 and eje2.
Figure
2. Biplot of the AMMI model for expansion volume, with 14 genotypes
(1,....14) and 6 environments (A,....F). PCA1 and PCA2 are represented
by eje1 and eje2.
Return to the MNL 74 On-Line Index
Return to the Maize Newsletter Index
Return to the MaizeGDB Homepage