In our previous paper it was described that the multiplasmic lines were successfully bred, biochemical markers were found, and morphological characters were described. In this paper, results of electron microscope observations of mitochondria are reported.
Materials used in this experiment were yellow young shoots for 11 of multiplasmic lines. The tip of yellow young shoots was taken as sample.
The transmission electron microscope observation on mitochondria in young shoots demonstrates that there is no significant difference in the structure of mitochondrial outer membrane, inner membrane, cristae and matrix among these eleven inbreds. The difference in size between (su1) Mo17 etc. and the control (Fli) Mo17 is not significant, but significant in terms of the number of mitchondria per cell. This means that the cytoplasm affects the growth of mitochondria. F-test demonstrates there is no significant difference in size of mitochondria among these eleven inbreds, either, while the difference in number of mitochondria per cell is highly significant, which is to say that the degree of nucleo-cytoplasmic interaction in different inbreds is not the same. See Tables 1-4.
Table 1. t-test in mitochondrion size (unit: um ) between (su1) Mo17
etc and (Fli) Mo17
| (Fli)
Mo17 |
(sul)
Mo17 |
(su2)
Mo17 |
(bt1)
Mo17 |
(Pop)
Mo17 |
(wx)
Mo17 |
(Teo)
Mo17 |
(T)
Mo17 |
(S)
Mo17 |
(C)
Mo17 |
(21A)
Mo17 |
|
| x | 0.684 | 0.663 | 0.797 | 0.669 | 0.628 | 0.700 | 0.658 | 0.764 | 0.782 | 0.746 | 0.783 |
| n | 20 | 20 | 20 | 20 | 20 | 20 | 20 | 20 | 20 | 20 | 20 |
| s2 | 1.422 | 0.452 | 3.660 | 1.115 | 2.212 | 1.286 | 0.463 | 2.031 | 0.994 | 0.541 | 1.761 |
| t | 0.430 | 1.420 | 0.270 | 0.831 | 0.269 | 0.538 | 1.221 | 1.790 | 1.252 | 157 |
Table 2. F-test in mitochondrion size among 11 maize lines
| SS | DF | MS | F | |
| treat interval | SSa=28.4362 | 10 | MSa=2.8436 | |
| treat internal | SSe=106.3851 | 220 | MSe=10.6385 | |
| total | SSt=131.2213 | 230 | ||
Table 3. t-test in number of mitochondrion per a cell between (su1)
Mo17 etc. and (Fli) Mo17
| (Fli)
Mo17 |
(sul)
Mo17 |
(su2)
Mo17 |
(bt1)
Mo17 |
(Pop)
Mo17 |
(wx)
Mo17 |
(Teo)
Mo17 |
(T)
Mo17 |
(S)
Mo17 |
(C)
Mo17 |
(21A)
Mo17 |
|
| x | 22.50 | 21.2 | 30.6 | 24.6 | 44.0 | 20.40 | 37.8 | 33.7 | 26.1 | 23.2 | 40.7 |
| n | 20 | 20 | 20 | 20 | 20 | 20 | 20 | 20 | 20 | 20 | 20 |
| s2 | 1.83 | 3.15 | 12.26 | 4.325 | 31.22 | 3.51 | 20.22 | 16.10 | 8.71 | 2.62 | 27.35 |
| t | 1.949 | 6.824 | 2.828 | 22.809 | 2.932 | 12.928 | 7.427 | 6.022 | 2.015 | 22.615 | |
| degree of
significant |
** | * | ** | * | ** | ** | ** | ** |
Table 4. F-test in number of mitochondrion per a cell among 11 maize
lines
| SS | DF | MS | F | |
| treat interval | SSa=8616.57 | 10 | MSa=2.8436 | |
| treat internal | SSe=1702.60 | 220 | MSe=10.6385 | |
| total | SSt=10319.77 | 230 | ||
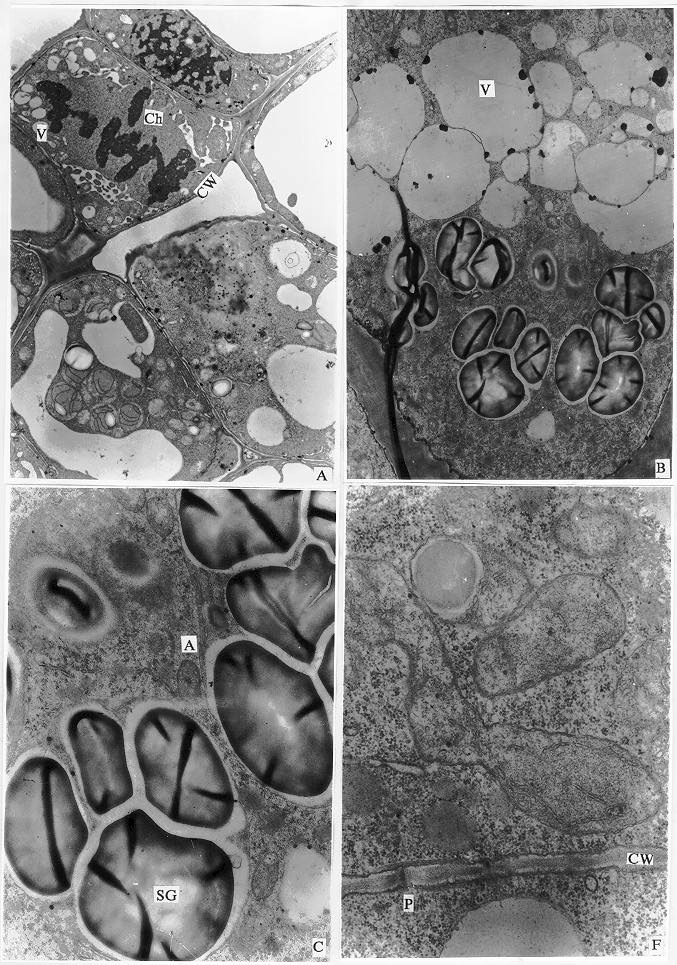
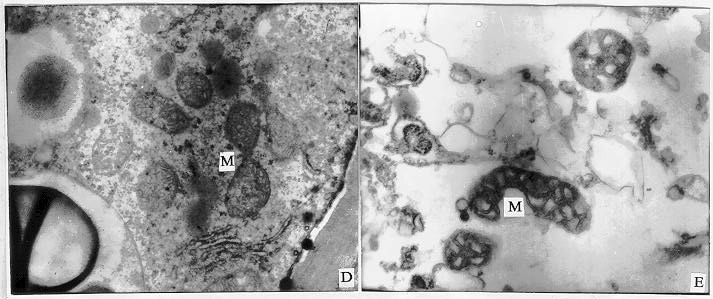
Other appearances were also observed (Plate I).
Plate I. A. A cell in mid-stage of dividing. B. Starch grains in a cell. C. Starch grains in an amyloplast. D. A mitochondrion just dividing. E. A dividing mitochondrion. F. Plasmodesmata. [Note: A-Amyloplast, CW-Cell Wall, Ch-Chromosome, M-Mitochondrion, P-Plasmodesmata, SG-Starch Grain, V-Vacuole. (X3000-25,000)]
Return to the MNL 72 On-Line Index
Return to the Maize Newsletter Index
Return to the MaizeGDB Homepage