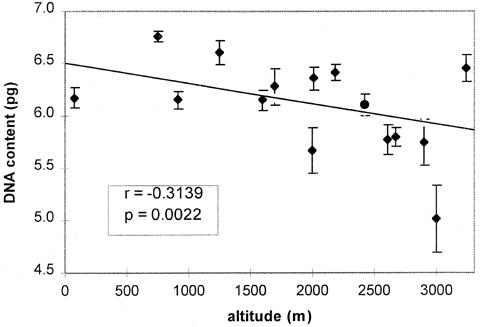
The DNA content of 17 populations (107 individuals) with varying mean frequencies of B-chromosomes (Bs) was determined (Table 1). The materials used are the same that were detailed in part l (Populational frequency and altitude) in this MNL. With the aim of studying the variation in DNA content of A-chromosomes (A-DNA) independently from the variation supplied by the Bs, this estimation was performed in plants without Bs (2n=20) (5 to 6.756pg). In these populations a 36% variation in DNA content of the members of the regular complement was demonstrated. This range of variation is very high compared with the values reported for 32 populations of maize from the USA and Mexico (Laurie and Bennett, Heredity 55:307-313, 1985; Rayburn et al. Am. J. Bot. 72:1610-1617, 1985). It was found that A-DNA content is negatively correlated with altitude of cultivation (r= -0.3139, p=0.0022) (Fig. 1). However, when non-polymorphic populations (VAV 6473 and 6474) were included in the analysis the correlation was not significant (r= -0.1012, p=0.3045) due in this case to their high A-DNA content.
Other authors also observed similar results. Rayburn (Evol. Trends Plant 4:53-57, 1990) found a negative correlation between total DNA content and altitude in 12 american populations of maize growing from 4900 to 7000 ft (1493 to 2134m).
The only exception was that reported by Rayburn and Auger (Theor. Appl. Genet. 79:470-474, 1990), who found an inverse relationship in 12 Indian maize populations collected from 100 to 5300 ft (31 to 1621m).
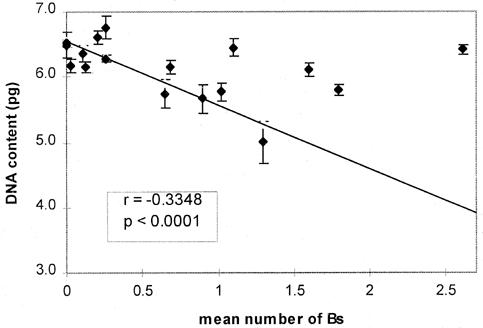
A significant negative correlation between mean DNA content (measured in 0B individuals) and the mean frequency of Bs per plant was found in the 17 populations (r=-0.3348, p<0.0001) (Figure 2) (Table 1). Interestingly, populations belonging to the same race also showed the same tendency. For instance, populations VAV 6484, 6476 and 6451, belonging to "Amarillo chico" race, with frequency of Bs of 0.20, 0.25 and 0.9 had decreasing values of A-DNA content (6.353, 6.280 and 5.665pg respectively). The same happened when populations VAV 6474, 6473 and 6167 (all from Altiplano race) were compared. The first two, cultivated at 3520m and 3620m, without Bs, had an A-DNA content of 6.5 pg and 6.49 pg whereas the VAV 6167, with a frequency of Bs of 1.29 showed a lower DNA content in the A genome (5.0pg) (Table 1).
A similar phenomenon was found by Longley (J. Agric. Res. 56:177-195, 1938) when analyzing the association between the number of knobs and the occurrence of Bs. He found that Bs are more frequent in plants with fewer than seven knobs in their A chromosomes.
Tito, Poggio and Naranjo (Theor. Appl. Genet. 83:58-64, 1991) observed that higher values of heterochromatin content (equivalent to knobs) are correlated with increasing values of total DNA content in several varieties and lines of maize. As has already been mentioned, the decrease of DNA content in 0B plants could be related to a decrease in heterochromatic bands (knobs).
In conclusion:
-The negative correlation between A-DNA content and altitude of cultivation
could be explained if genome size played an adaptive role in relation to
environmental variables.
-The positive correlation between frequency of plants with Bs and altitude
is closely related to the A-DNA amount.
-The negative correlation between frequency of plants with Bs and A-DNA
amount indicates that Bs are better tolerated in populations with lower
A-DNA values.
-The results obtained would indicate that there would be a maximum
limit to the mass of nuclear DNA or nucleotype (Bennett, New Phytologist
106 (Suppl.):177-200, 1987) so that Bs would be tolerated as long as this
maximum limit is not exceeded.
-The clinal variation of A-DNA content and the consequent inverse correlation
of B frequencies over an altitudinal gradient could have an adaptive significance,
since the populations analyzed were not distributed over a transect (Fig.
1). They were cultivated by aborigines and hardly interbreed with each
other. Therefore, historical isolation of populations with high and low
A-DNA content by genetic drift at both extremes of an altitudinal gradient,
and subsequent gene flow between them, is not a very plausible explanation.
Table 1. Races, altitude of cultivation, mean number of Bs, and mean
DNA content of plants without B chromosomes.
| Race | Population | Altitude (m) | Mean number of Bs | DNA content ±SE (pg) (no. plants) |
| Blanco | VAV 6479 | 2180 | 2.615 | 6.410 ±0.08 (3) |
| Blanco | VAV 6485 | 2670 | 1.795 | 5.800 ±0.09 (6) |
| Amarillo grande | VAV 6480 | 2420 | 1.596 | 6.105 ±0.10 (8) |
| Altiplano | VAV 6167 | 3000 | 1.294 | 5.007 ±0.25 (4) |
| Harinoso | VAV 6475 | 3240 | 1.100 | 6.450 ±0.13 (6) |
| Capia blanco | VAV 6418 | 2600 | 1.020 | 5.767 ±0.14 (6) |
| Amarillo chico | VAV 6451 | 2000 | 0.900 | 5.665 ±0.22(6) |
| Pisingallo | VAV 6313 | 1600 | 0.684 | 6.148 ±0.10 (8) |
| Capia rosado | VAV 6162 | 2900 | 0.649 | 5.741 ±0.22 (3) |
| Amarillo chico | VAV 6476 | 1690 | 0.255 | 6.280 ±0.18 (6) |
| Blanco y ocho rayas | VAV 6481 | 750 | 0.255 | 6.756 ±0.05 (7) |
| Amarillo chico | VAV 6484 | 2010 | 0.204 | 6.353 ±0.19 (7) |
| Orgullo cuarentón | VAV 6482 | 910 | 0.122 | 6.150 ±0.08 (6) |
| Blanco y ocho rayas | VAV 6483 | 1250 | 0.111 | 6.601 ±0.12 (4) |
| Pichingá | VAV 6170 | 80 | 0.023 | 6.172 ±0.10 (4) |
| Altiplano | VAV 6474 | 3520 | 0.000 | 6.514 ±0.05 (7) |
| Altiplano | VAV 6473 | 3620 | 0.000 | 6.493 ±0.20 (6) |
Figure 1. Correlation of A-DNA content (in plants without Bs) with altitude.
Figure
2. Correlation of A-DNA content (in plants without Bs) with number
of Bs per plant in its population.
Return to the MNL 71 On-Line Index
Return to the Maize Newsletter Index
Return to the MaizeGDB Homepage