Teosinte glume architecture1 controls silica deposition in
the glumes of maize
--Jane E. Dorweiler and John Doebley
Teosinte glume architecture1 (tga1) has several effects on the glumes of maize, with the homozygous teosinte allele (tga1/tga1) making the glumes more teosinte-like (Dorweiler et al., Science 262:233-235, 1993). One of these effects is to make the glumes of maize more highly indurated (harder).
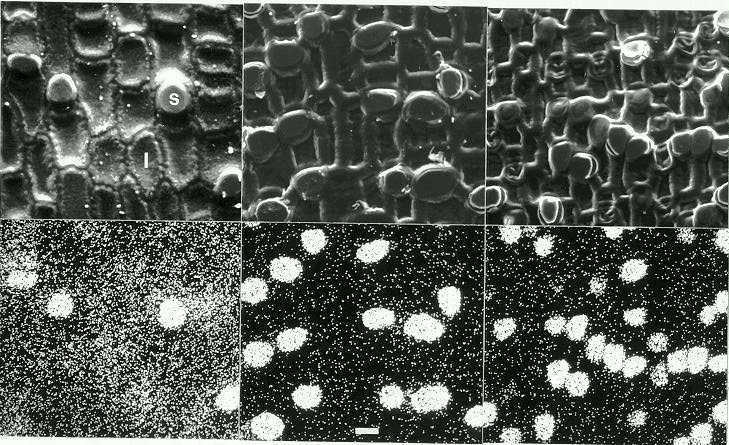
In an effort to understand the developmental basis for this difference, we have looked at silica deposition in the glumes representing the three genotypes at tga1 in the W22 background. We used X-ray microanalysis to investigate silica deposition. We found that the standard W22 line (Tga1/Tga1) has high concentrations of silica in the short cells of the glumes, but that the long cells have virtually no deposition of silica. The heterozygotes (Tga1/tga1) have a similar silica distribution to Tga1/Tga1 homozygotes. The teosinte allele homozygotes (tga1/tga1), though they still have high silica deposition in their short cells, have additional silica deposited in the long cells of the glumes (Figure 1).
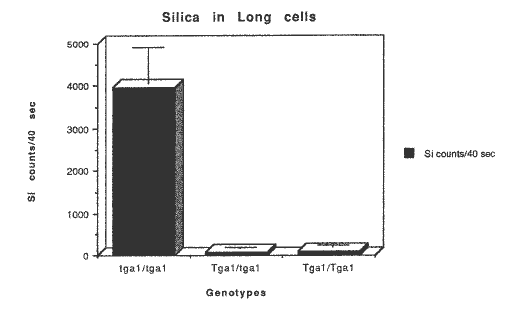
The amount of silica in the long and short cells was also quantified using X-ray microanalysis. The amount of silica in the short cells of all three genotypes is essentially the same. The amount of silica in the long cells of the homozygous teosinte allele at tga1 is nearly 40x the amount of silica in the long cells of both the maize homozygote and the heterozygote (Figure 2).
Thus, in addition to the effects previously noted for teosinte glume architecture1 (Dorweiler et al., Science 262:233-235, 1993), this locus seems to have an effect on the distribution of silica in the abaxial epidermal cells of the glumes. This phenomenon appears to at least partially explain the induration differences between the maize and teosinte alleles at tga1, and thus the differences in glume induration between maize and teosinte.
Acknowledgments: Special thanks to Dr. Anne Sylvester, A for suggesting the analysis of silica deposition and teaching one of us (JED) this technique.
Figure 1. SEM micrographs of glumes of the three genotypes at tga1 (top row) and their corresponding silica dot maps (bottom row). In each SEM micrograph, silica cells (s) are visible. The corresponding dot maps show a high density of silica X-rays (dots) mapping to these silica cells. The teosinte allele homozygotes (tga1/tga1) at left also have a high number of silica X-rays mapping to the long epidermal cells (l). Bar represents 15 µm for all six photos.
Figure
2. Silica in long cells for each genotype. This graph shows the amount
of silica in long cells for the abaxial epidermis of glumes from the three
genotypes at tga1. The y-axis represents the average number of silica
(Si) X-rays emitted from long cells during a 40 second interval. Averages
calculated from three 40 second readings on 3 cells for each genotype.
Return to the MNL 68 On-Line Index
Return to the Maize Newsletter Index
Return to the MaizeGDB Homepage