In a preceding report we have shown the exact procedures, expurgated from allometric effects, to calculate p from backcross progenies. Here we will derive the formulas for F2 and illustrate them with data from D.H. Langham (Genetics 25:88-107).
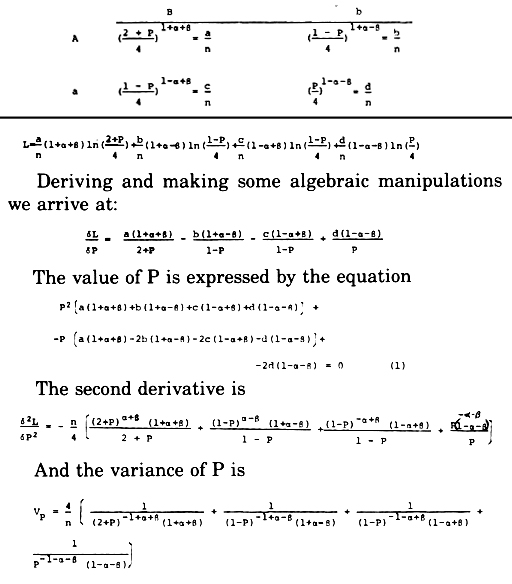
The observed and expected values in a F2 segregation can be described as follows in a 2x2 table:
The symbols are standard, and use b for the allometric effect of B gene and a for A gene to account for differential penetrance or viability.
The logarithmic likelihood expression turns to
Deriving and making some algebraic manipulations we arrive at:
The value of P is expressed by the equation
The second derivative is
And the variance of P is
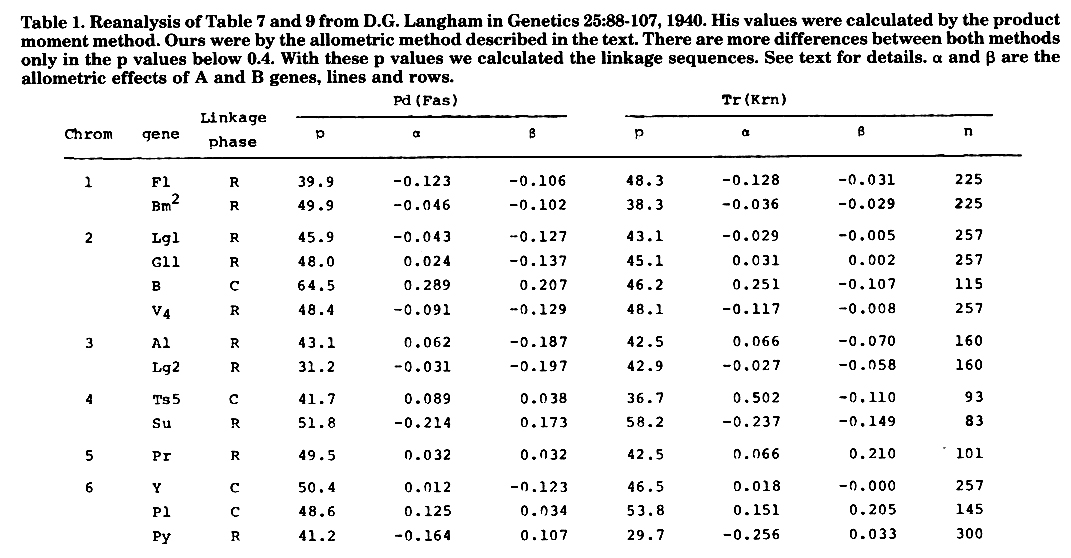
D.H. Langham studied linkages of pd and tr of Durango teosinte with maize markers. His chief conclusion is that the gene tr is linked to the gene pd, with 20 percent recombination between only one pair of loci. We will try to show that his conclusions are very conservative. In Table 1 we present the results by the allometric method here proposed; with only one more digit than Langham used. He calculated p by the product moment method. In 28 cases we have 23 cases with a value of p below 0.5. The chi-square gives 11.57**, significant beyond any reasonable doubt. This means that for the whole, the markers in general are linked to tr and pd, and so there are tr or pd genes or both in all or nearly all chromosomes tested. Langham's data do not permit the calculation within each chromosome of pd with tr nor the linkages among the different markers used. This removes much of the efficiency of our method of the differences, but with the available data we applied it making algebraic means of the differences.
Comparing Langham's p values with ours we verify a very close agreement for values of p between 0.4-0.5 (within 1%). Below 0.4 downwards to 0.3 the difference increases to nearly 2%. That is, it seems that the product ratio method is almost fully efficient in eliminating allometric effects at loose linkages in F2. Its efficiency falls as p tends to zero and then our exact method should be used profitably. Regarding fasciation, Langham reported "A mutation to single spikelets in an inbred line of maize was discovered by the writer. When he crossed maize with teosinte the F1 ears had single spikelets instead of the usual paired spikelets. The F2 ears likewise, were homozygous for single spikelets. The inbred line of maize used in this cross has a fasciated type of ear, and its single spikelets would not have been noticed except for the cross with teosinte" [sic]. We regard tr and pd as allelic to our Krn and Fas reported elsewhere.
The error variance was first calculated by the standard F2 formula (the p values by both methods are very near). The variance of cM was first calculated as VcM = (cM/p)2 x Vp. A covariance was calculated with the cM values used in the calculus. If positive we let it be. If negative it was added two times to the original variance of cM. Thus, it is a maximum error variance.
For #1 we have arrived at direct solitary measures in cM of F1 Pd1 52.0 ± 7.2 and Bm2 Tr1 48.4 ± 7.1. With four measures by differences we have Pd1 Tr1 23.8 ±12.4, between F1 Bm2. Intrapolating the sum of the three measurements for the F1 Bm distance we arrive at (F1 86) (Pd1 117) (Tr1 132) (Brn2 161).
For #2 by differences, with four measurements we have Pd Tr 13.2 ± 6.1 lg1 gl2 by one pair difference gives 2.0 ± 10.1. Lg1 Tr gave 59.9 ± 7.0. B results are unreliable and V4 is too far away although congruent and we arrive at (Pd2-45) (Tr2-32) (lg1 28) (gl2 30). In the mapping of Lsc (latente stomatal control) a Krn2 was found in position 10. Here Tr2 lg1 distance is grossly overestimated by direct measurement.
For #3 the single measure lg2 Pd3 is 36.5 ± 8.3. Tr3 a1 gives 42.6 ± 8.8. By difference with two pairs we have Pd3 Tr3 10.7 ± 9.0. Intrapolating the total of the three measures in the known distance lg2 a1 we have (lg2 93) (Pd3 113) (Tr3 118) (a1 141).
For #4 distance Pd4 Tr4 by one single pair difference 10.2 ± 12.4 Tr Ts directly is 45.6 ± 14.4. Most probable sequence is (Pd4 3) (Tr4 7) (Ts5 53).
For #5 by difference of the only pair available Pd5 Tr5 is 41.0 ± 20.4, and the order is (Pr 67) (Tr5 125) (Pd5 166) with no indication of orientation.
For #6 we have a single estimate for Py Tr6 34.1 ± 6. 0 and a single pair difference for Tr6 Pd6 20.8 ± 8.7 which gives the sequence (Py1 65) (Tr6 99) (Pd6 119) in the map positions.
There seems to be a certain correspondence between Pd Tr and knob position within each chromosome in all cases.
Luiz Eugenio Coelho de Miranda and Luiz Torres de
Miranda
Return to the MNL 61 On-Line Index
Return to the Maize Newsletter Index
Return to the MaizeGDB Homepage