A relatively new technique in plant analysis is the use of chromatography to separate up to 100 or more components in a single sample, producing complex chromatograms, which have been termed "metabolic profiles." Metabolic profiling, because it measures so many different substances, may be useful in examining problems such as pathogen resistance, which have been very difficult to study by techniques which measure or separate only a few substances at one time. In our laboratory, we have therefore begun using metabolic profiling to examine the molecular basis of pathogen resistance in maize. We have developed simple methods for extruding water-soluble compounds from maize leaves and have used high performance liquid chromatography (HPLC) to measure the relative amounts of more than 50 components in these samples. We have investigated profiles from several varieties of maize, including lines isogenic for a specific pathogen resistance. This report describes our initial results from such studies.
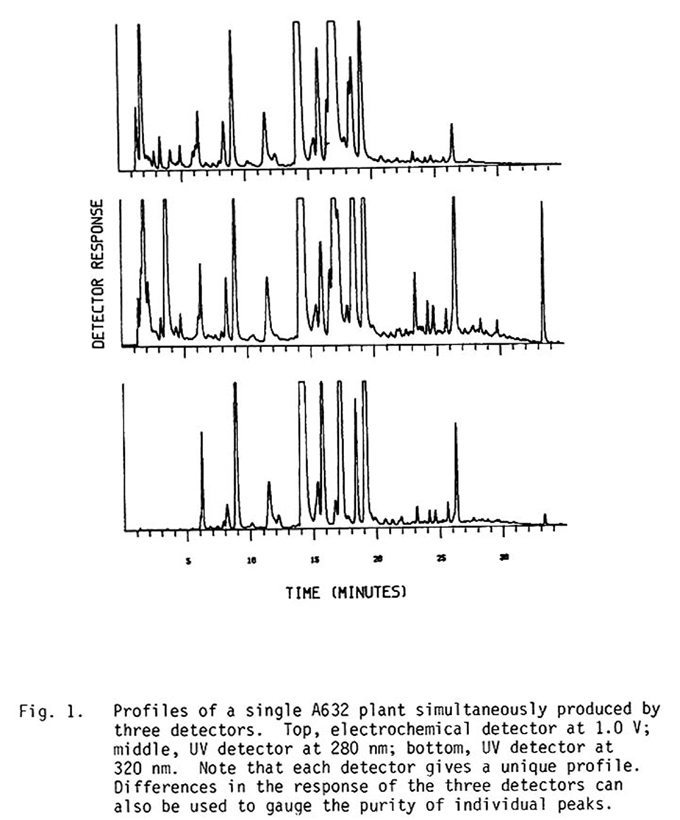
One-half gram of maize leaves from 18-day-old seedlings raised in a greenhouse in sand were squeezed in a press designed for preparing KBr pellets for infrared spectrometry. The "juice" was filtered through a 0.22 micron filter and 20 microliters injected into a dual-pump, microprocessor-controlled HPLC. The components in the sample were separated on a reverse phase analytical column, and detected using two UV detectors and an electrochemical detector (Figure 1). The HPLC mobile phase consisted of a pH 2.1 phosphate buffer (O.2M)/acetonitrile gradient. We collected data on a minicomputer which has hard disks and the necessary peripherals for data acquisition, storage, and plotting.
The peak areas of each chromatogram were calculated by the computer system and compared. For the 40 to 50 peaks that could be accurately measured by the computer, we observed an overall precision of 15% (median relative standard deviation) when "corn squeezings" from subsamples of the same sample were each analyzed on the HPLC. The sample preparation time is less than 15 minutes; thus, sample degradation is minimized. The time required to analyze each sample with the HPLC is about one hour. Thus we can quantitate nearly one peak per minute.
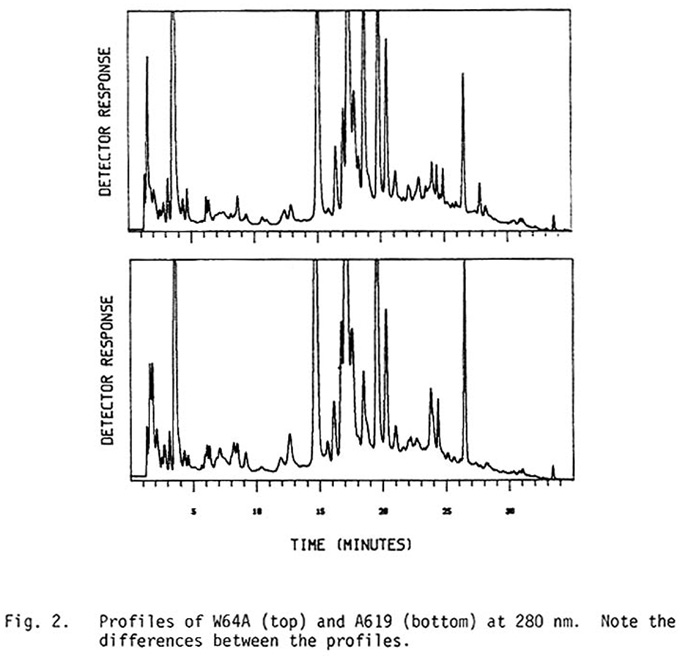
We have examined a number of maize inbreds and found that each inbred produces a unique profile (Figure 2). As expected, closely-related inbreds have highly similar but distinguishable profiles. Clearly, the genotype of the inbred is reflected in the profile (phenotype).
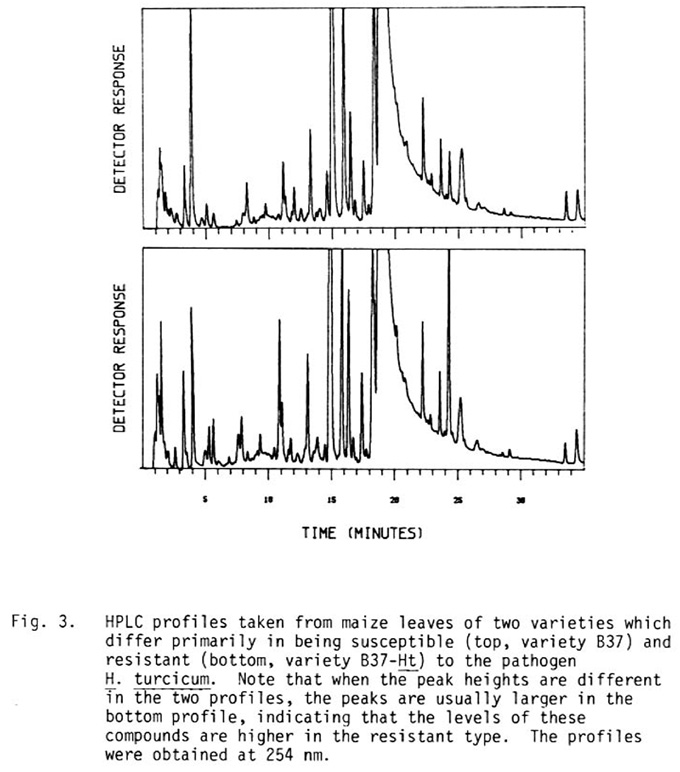
Plants which are known to be resistant to a specific disease, and "isogenic" plants which are not resistant to that disease but which are otherwise genetically as similar as possible, were also analyzed using this technique. Profiles showed clear differences between resistant and susceptible types (Figure 3).
Most of the compounds which we detect in these samples appear to be low molecular weight organic acids and amino acids; the technique is particularly sensitive to phenolic acids. Thus, the compounds detectable by the HPLC include many of the known primary and secondary metabolic intermediates in maize, and many of the substances already known to be involved in disease resistance. It will clearly be necessary: (1) to run much larger numbers of samples, (2) to chemically identify compounds putatively associated with the resistance or other trait, and (3) to perform similar tests on samples from segregating backcrosses before the results from such studies can be accepted as demonstrating that these compounds are in fact associated with that trait. Even if the compound(s) thus identified are not the direct causal agents of the trait, they may prove useful in the eventual elucidation of the trait at the molecular level. However, we anticipate that this technique will eventually prove useful in studying not only disease resistance, but also other problems of agronomic significance, and that plant breeders may eventually be able to use specific compounds as markers in helping them to design crosses to achieve specific goals.
Fig. 1. Profiles of a single A632 plant simultaneously produced by three detectors. Top, electrochemical detector at 1.0 V; middle, UV detector at 280 nm; bottom, UV detector at 320 nm. Note that each detector gives a unique profile. Differences in the response of the three detectors can also be used to gauge the purity of individual peaks.
Fig. 2. Profiles of W64A (top) and A619 (bottom) at 280 nm. Note the differences between the profiles.
Fig. 3. HPLC profiles taken from maize leaves of two varieties which differ primarily in being susceptible (top, variety B37) and resistant (bottom, variety B37-Ht) to the pathogen H. turcicum. Note that when the peak heights are different in the two profiles, the peaks are usually larger in the bottom profile, indicating that the levels of these compounds are higher in the resistant type. The profiles were obtained at 254 nm.
James W. Webb, Stephen C. Gates and David F. Weber
Return to the MNL 57 On-Line Index
Return to the Maize Newsletter Index
Return to the MaizeGDB Homepage