Let p be the frequency of a more favorable gene in tolerance to heat,
say lte1; 1-p the frequency of a less favorable gene, lte1, allelic to
lte1; a, half the difference between the two homozygous genotypes; and
d the degree of dominance; with K being the average value of the less favorable
gene. The conventional representation of the basic genetic parameters is
represented as follows:
| Genotypic value | ||||
| Genotype | Frequency. | Number of favorable genes | Uncoded W' | Coded W=W'-K-a |
| lte1/lte1 | p2 | 2 | K+2a | a |
| Lte1/lte1 | 2p(1-p) | 1 | K+a+da | da |
| Lte1/Lte1 | (1-p)2 | 0 | K | -a |
The problem is a. Suppose a represents the effect
of one gene on survival, or fitness. In percent under no stress, a would
be zero, and it could happen in the other extreme that one genotype survives
100%, the other 0%. In this case a would be 50%. In this model a is one
point in space-time. The definition of a new a which takes into account
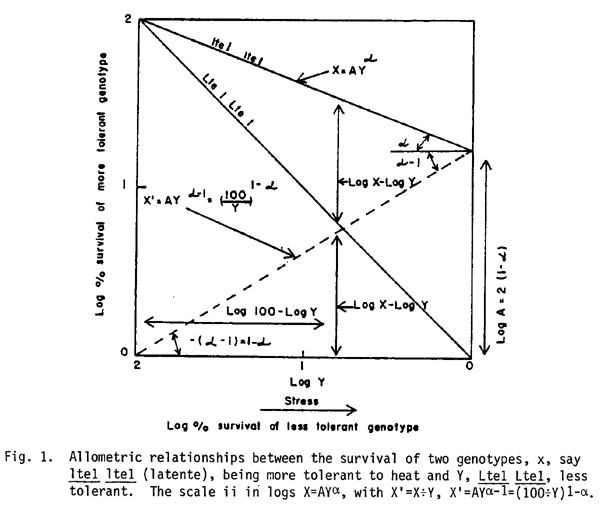
space-time must be in terms of an angle. In the relationship of allometry,
being X and Y two measures, they are usually related by X=AYa
(J. S. Huxley, Problems of Relative Growth, 1932), really related X-Y with
Y. Relating X÷Y with Y leads to the allometric relationships shown
in Fig. 1. It shows that a
and A are redundant, A being the antilog 2(1-a)
and the simplest representation being X' = (100÷Y)1-a.
The conventional interpretation is a point in those lines. Substituting
1-a and d
for d in the conventional representation we have a genetic interpretation
of the allometric relationships as follows:
|
|
||||
| Genotype | Frequency | Number of favorable genes | Uncoded
W' |
Coded
W=W'-K-(1-a) |
| lte1/lte1 | p2 | 2 | K+2(1-a) | 1-a |
| Lte1/lte1 | 2p(1-p) | 1 | K+(1-a)+d(1-a) | d(1-a) |
| Lte1/Lte1 | (1-p)2 | 0 | K | a-1* |
*See in Fig. 1 that -(a-1) = 1-a
This also opens the way to analyze, and to map, single genes with quantitative effects including survival or fitness. It should be warned that the best fit is gotten calculating by the minimum products method derived by G. Teissier (Biometrics No. 1, 4:14-53, 1948). The minimum squares method underestimates the absolute value of the coefficients. It is interesting to point out that L. I. Gripi-Papp (Dr. Thesis, ESALQ. Univ. of Sao Paulo, 1970) in a demonstration of X=AYaarrived first at the form X'=AYa-1.
Luiz Torres de Miranda
Return to the MNL 55 On-Line Index
Return to the Maize Newsletter Index
Return to the MaizeGDB Homepage